Dashboard
The Lawless Analytics Dashboard is a easy and powerful tool that replaces systems like hotjar or google analytics, and it's always free.
Overview
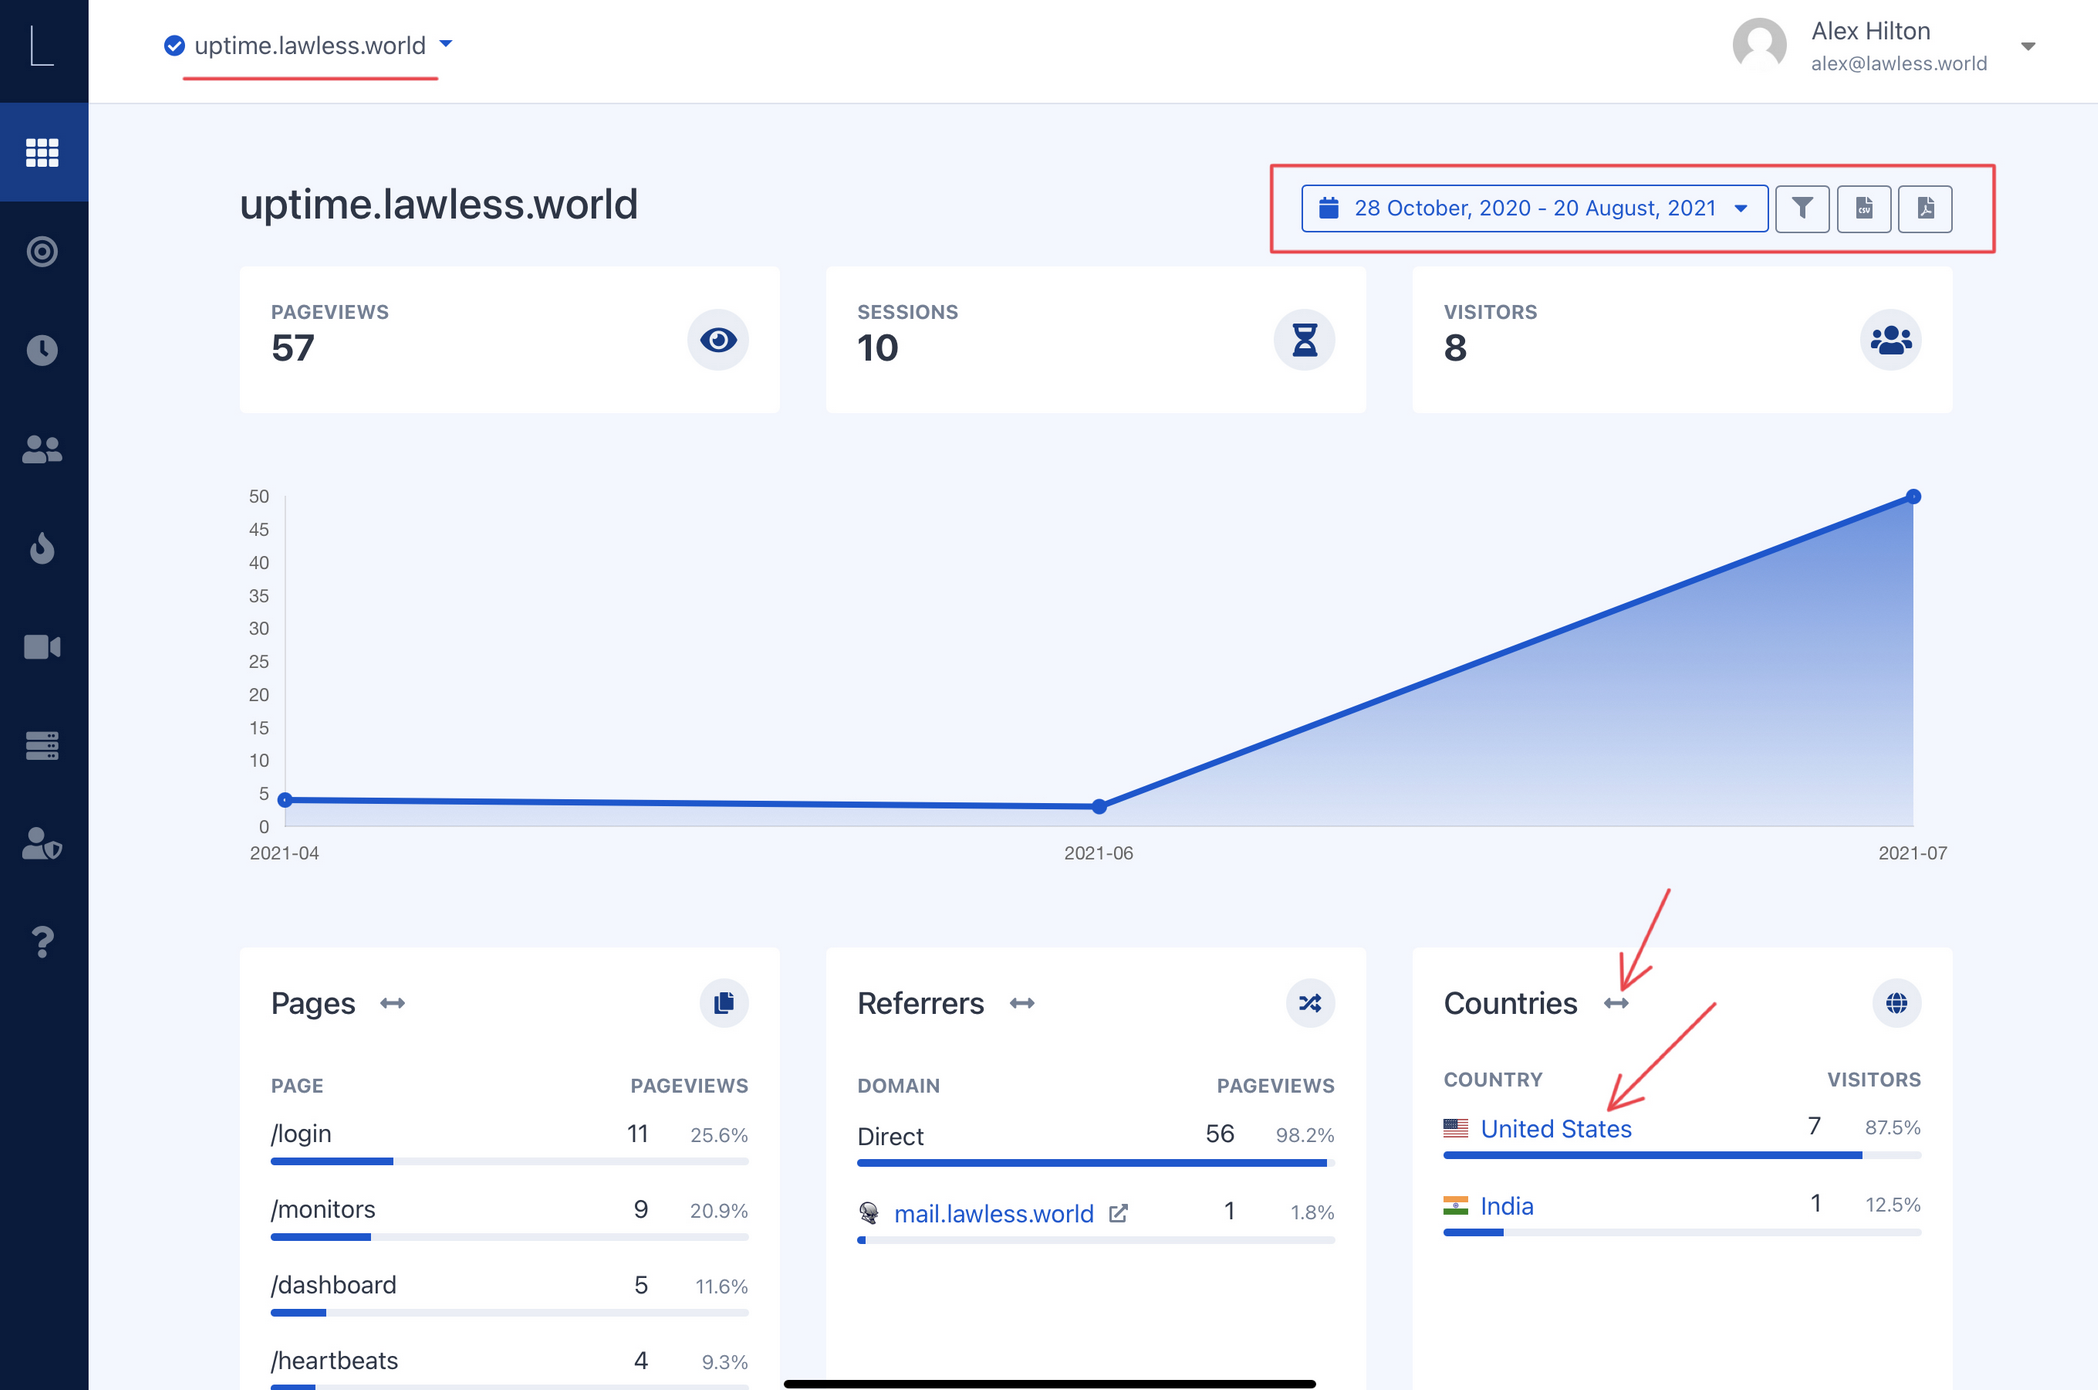
Once you just login to the Lawless Analytics platform for the first time, the first page you will be brought to is your Dashboard Page. The Dashboard is a wealth of information but at first glance appears quite basic. In actuality this is done by design, I believe that the data initially presented in your Dashboard is what most monitors of these types of systems look for or at the very least it's what I look for so it fulfills my needs.
Filters
Lawless Analytics allow you to customize your dashboard to how you see fit. This is a powerful feature of the system and we've dedicated an entire section to it labeled Filters. You can create as many filters as you can mentally handle and as the system is continued to be developed, the platform we will have more options to choose from.
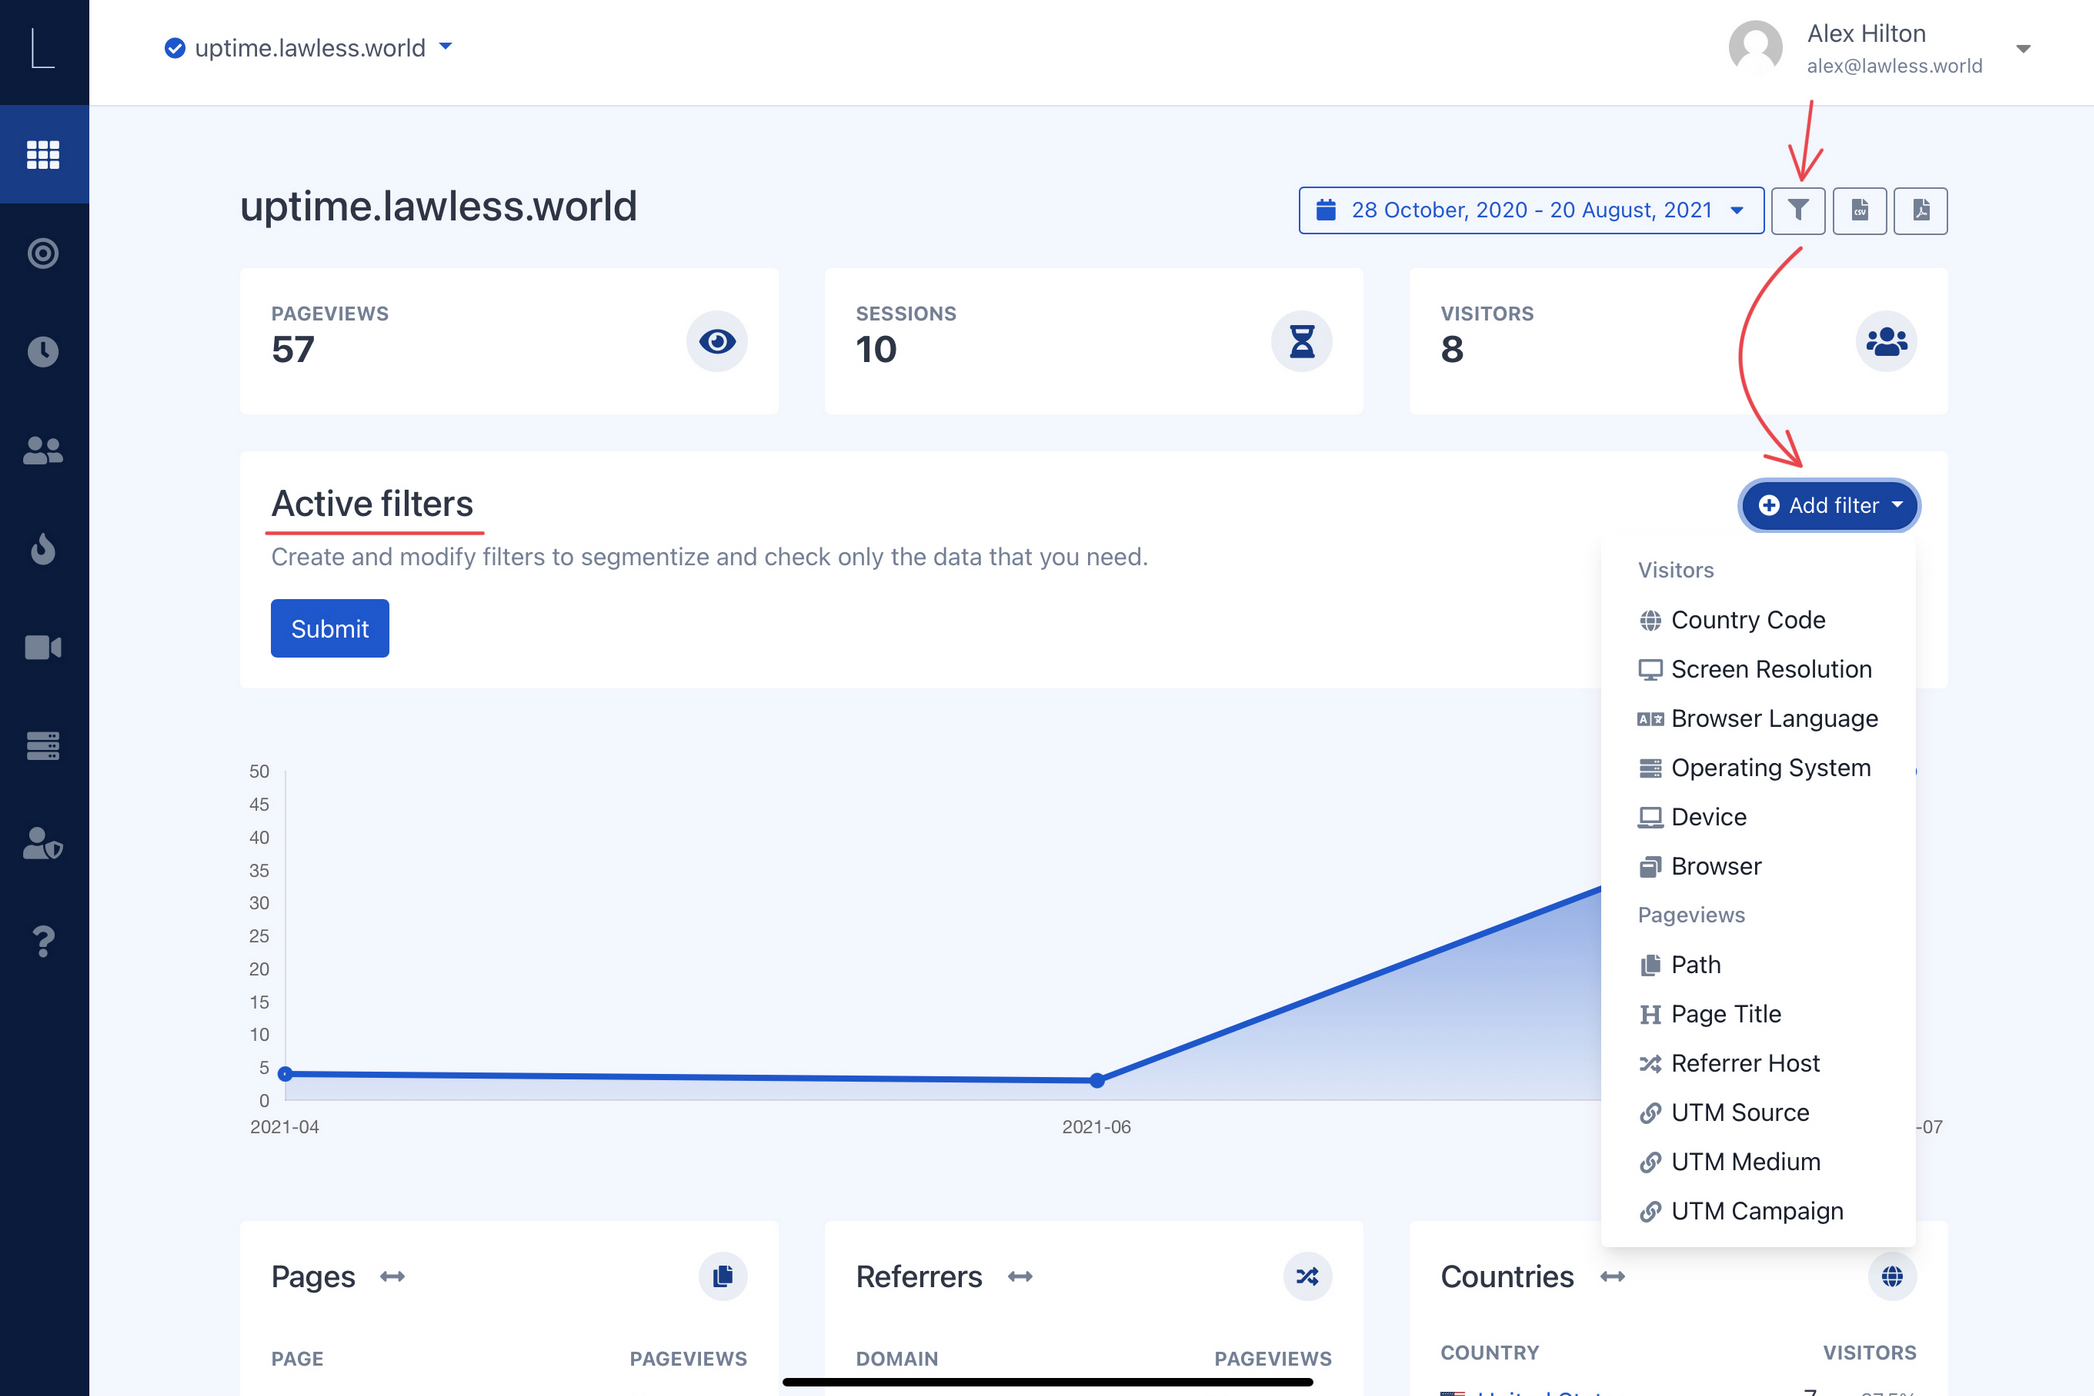
In the image above clicking the filter icon to the right of the date picker will bring the option to add filters to your web data. You can make a unlimited number of combinations and can export the results there after.
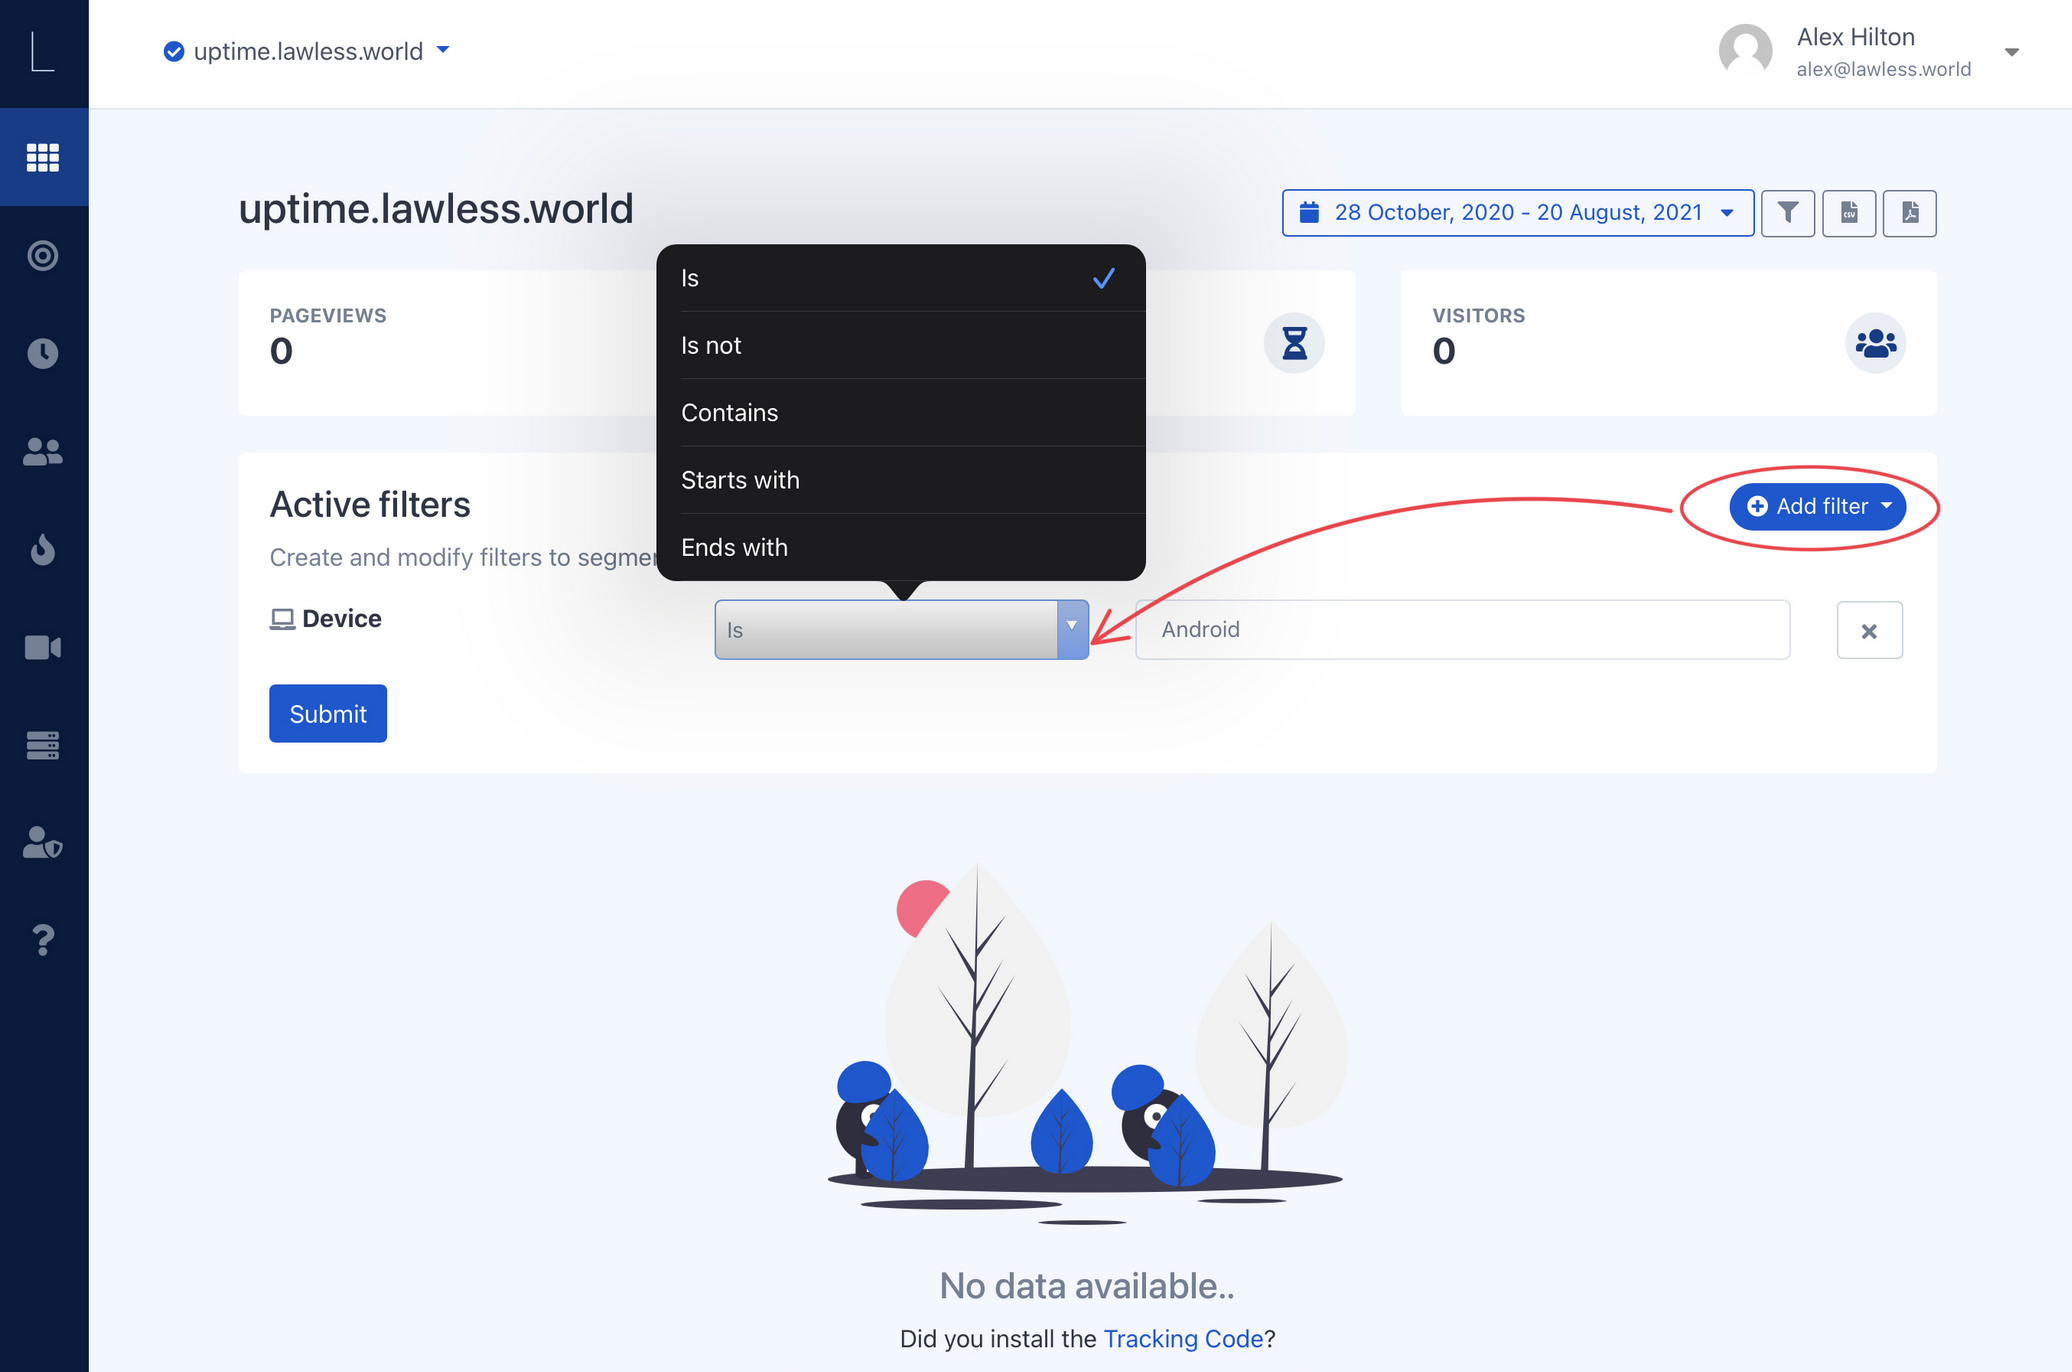
Once you've selected your chosen filter you can select the parameters that will surround it. In the example shown above, you see I can assign the device type a few member of variables:
- Is - this dictates that the device “IS” an android device
- Is not - means just that, the device “IS NOT” an android device
- Contains - Will show any device view if it contains android
- Start's with - chrome can be typed, anything you prefer to receive the desired data results
- Ends with - the opposite of start's with
As you can see you can create an undaunted number of ways to perceive your data. Furthermore you can add filter after filter. In the image below I've added multiple filters.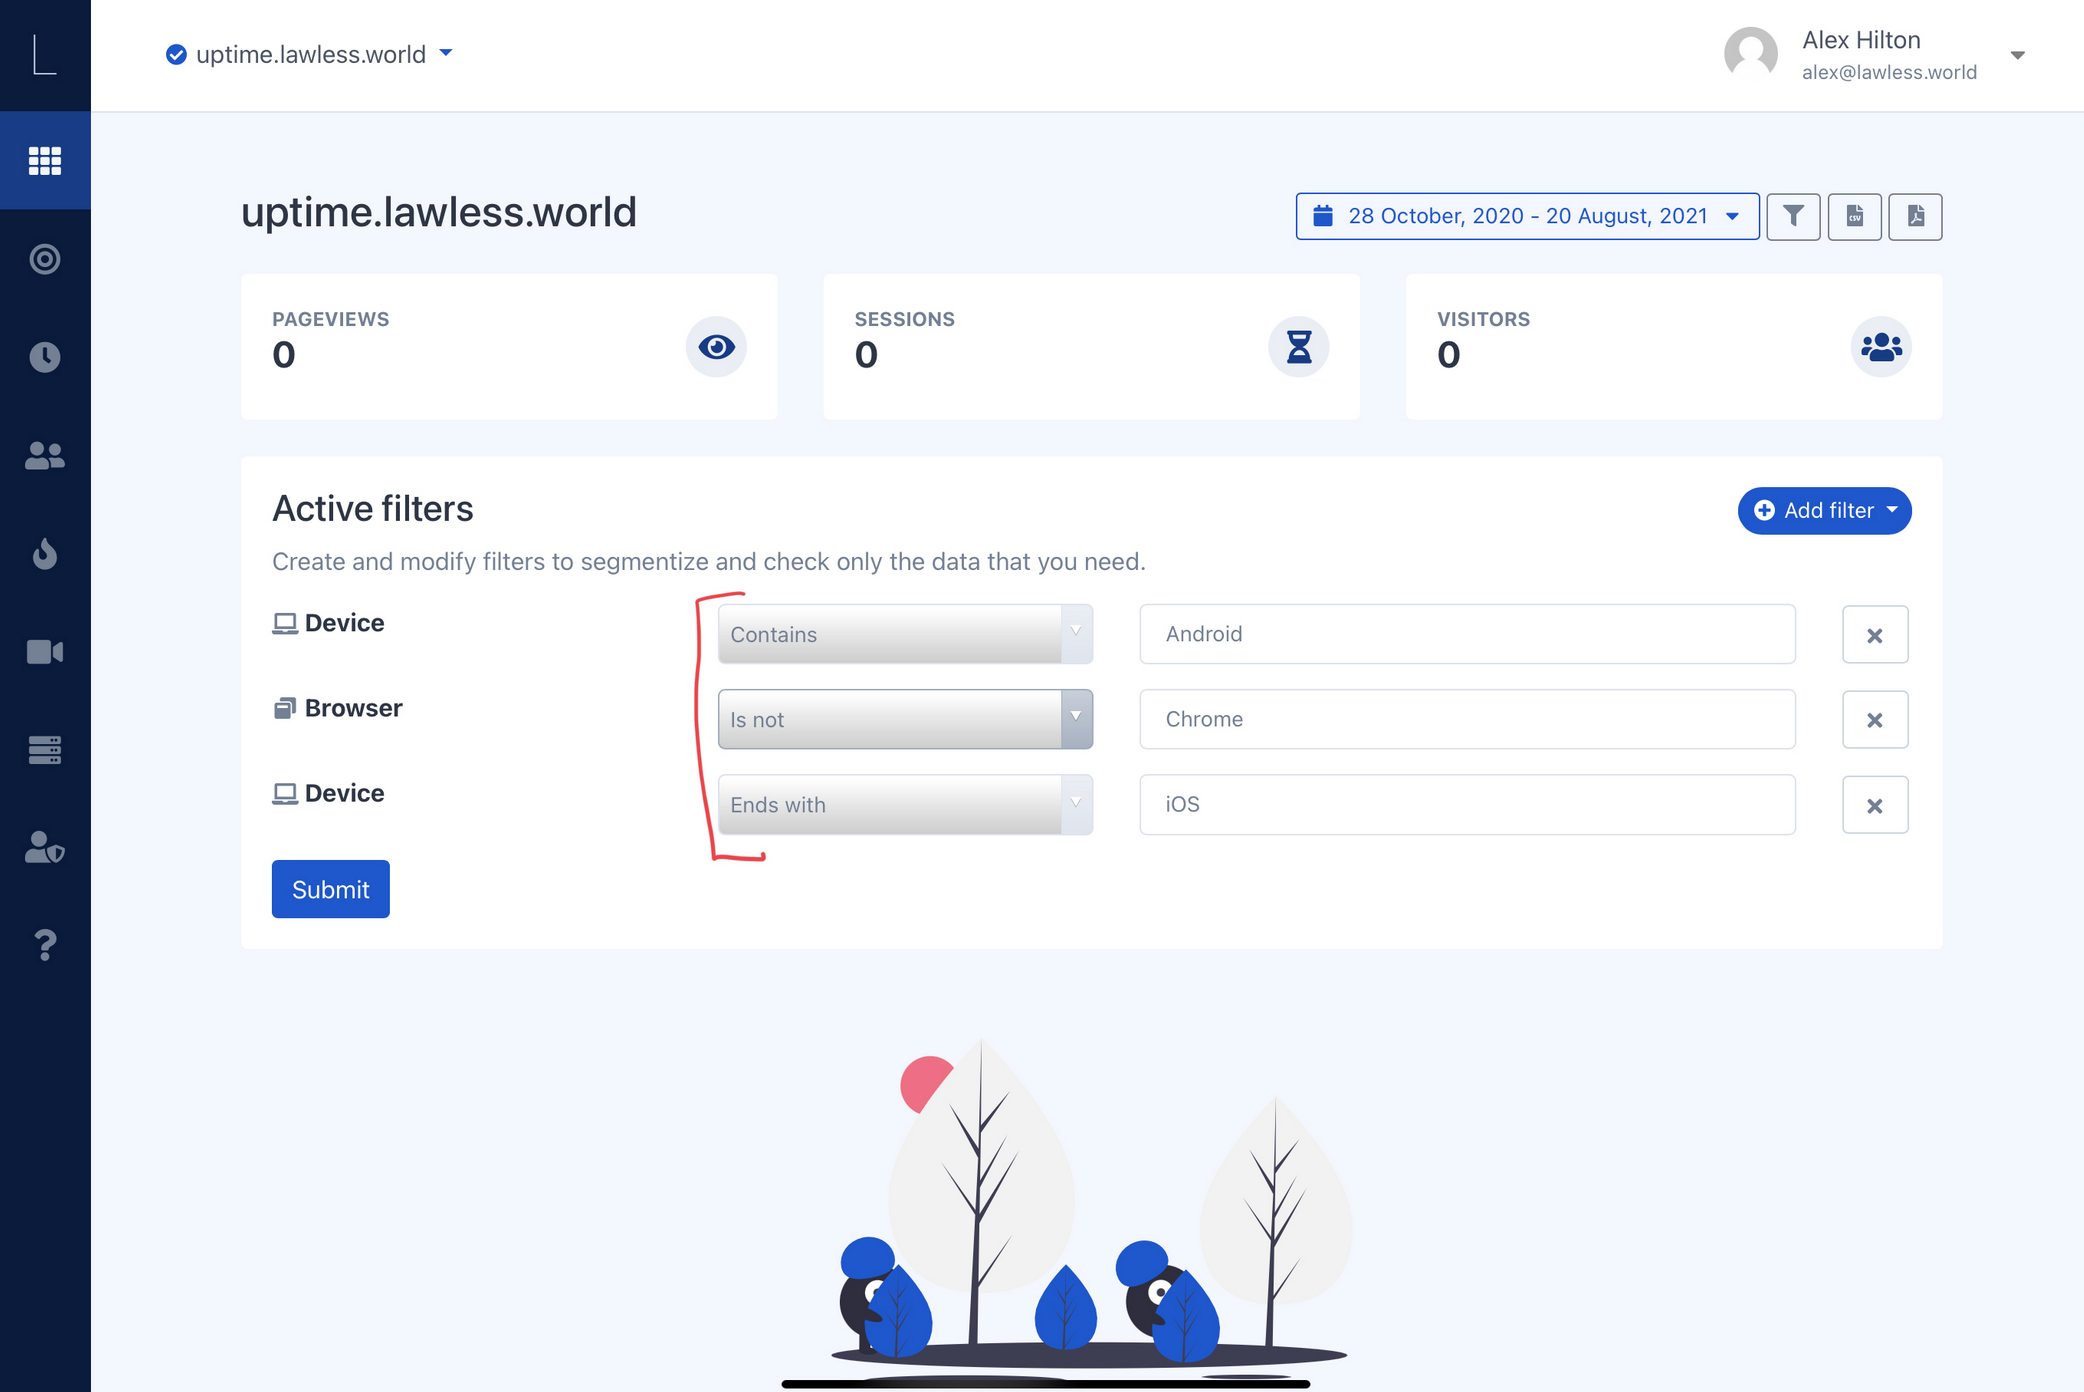
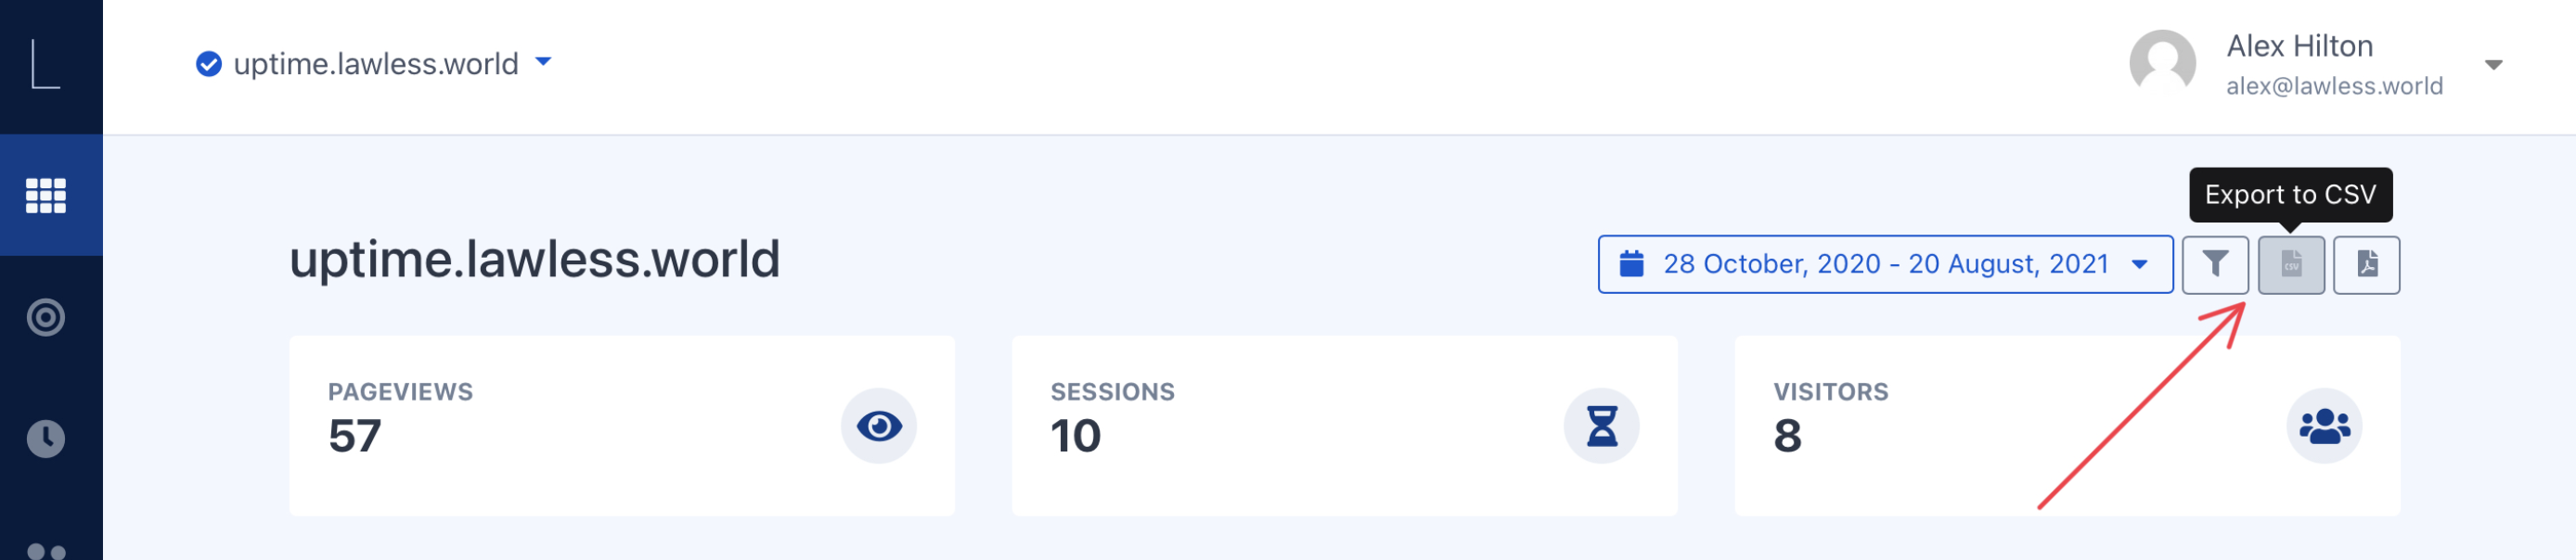
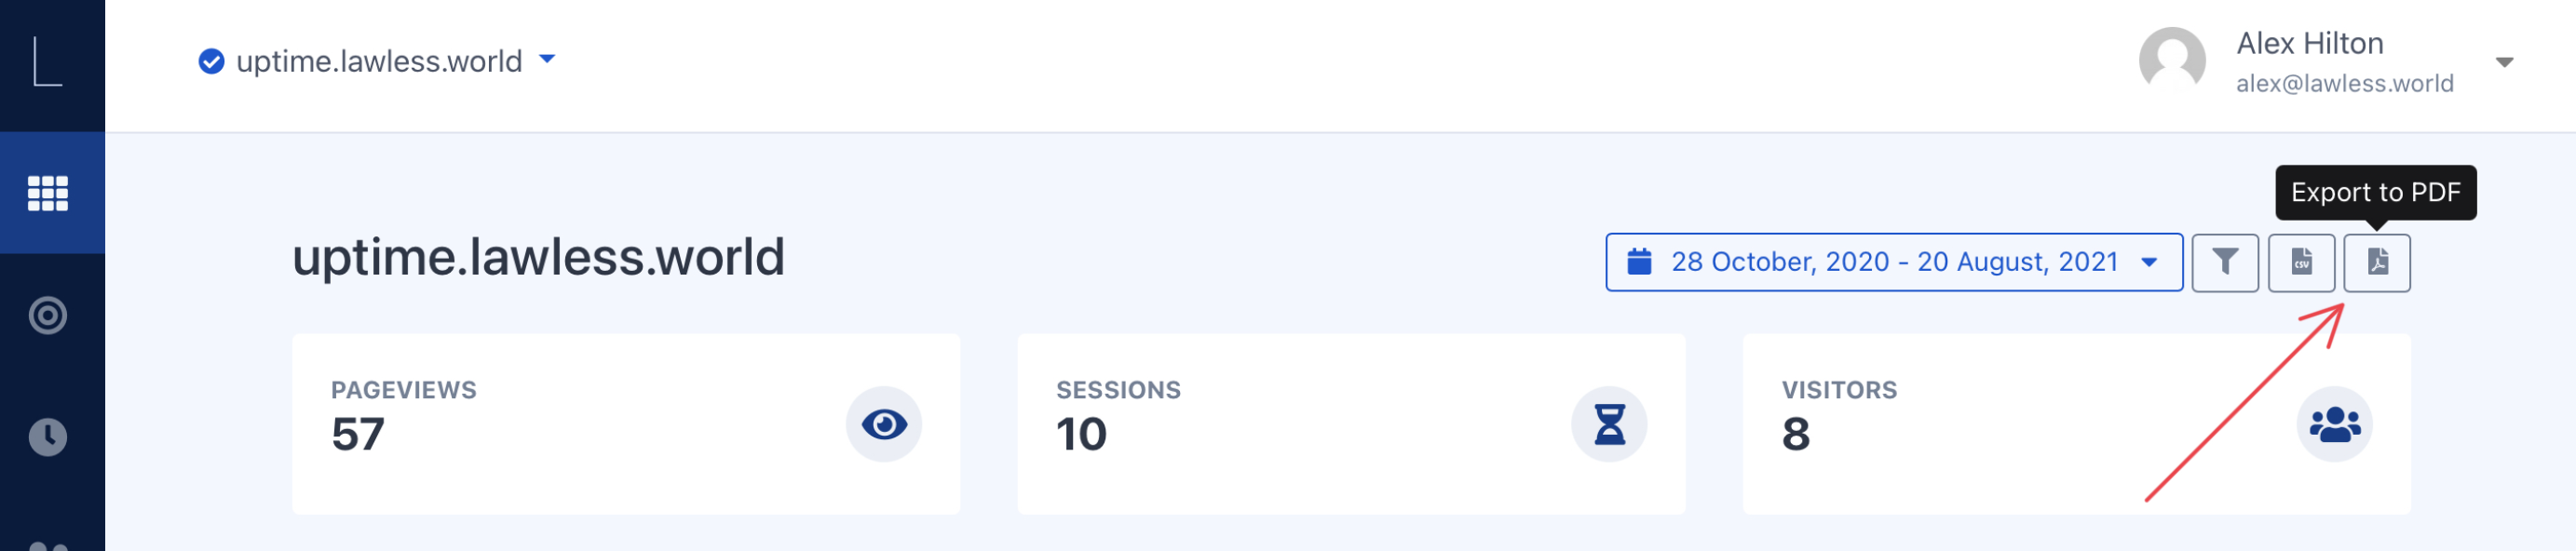
Exporting data
Extracting your data in either csv or pdf format is literally as easy as clicking are icon. Pretty straightforward and does not require much explanation.
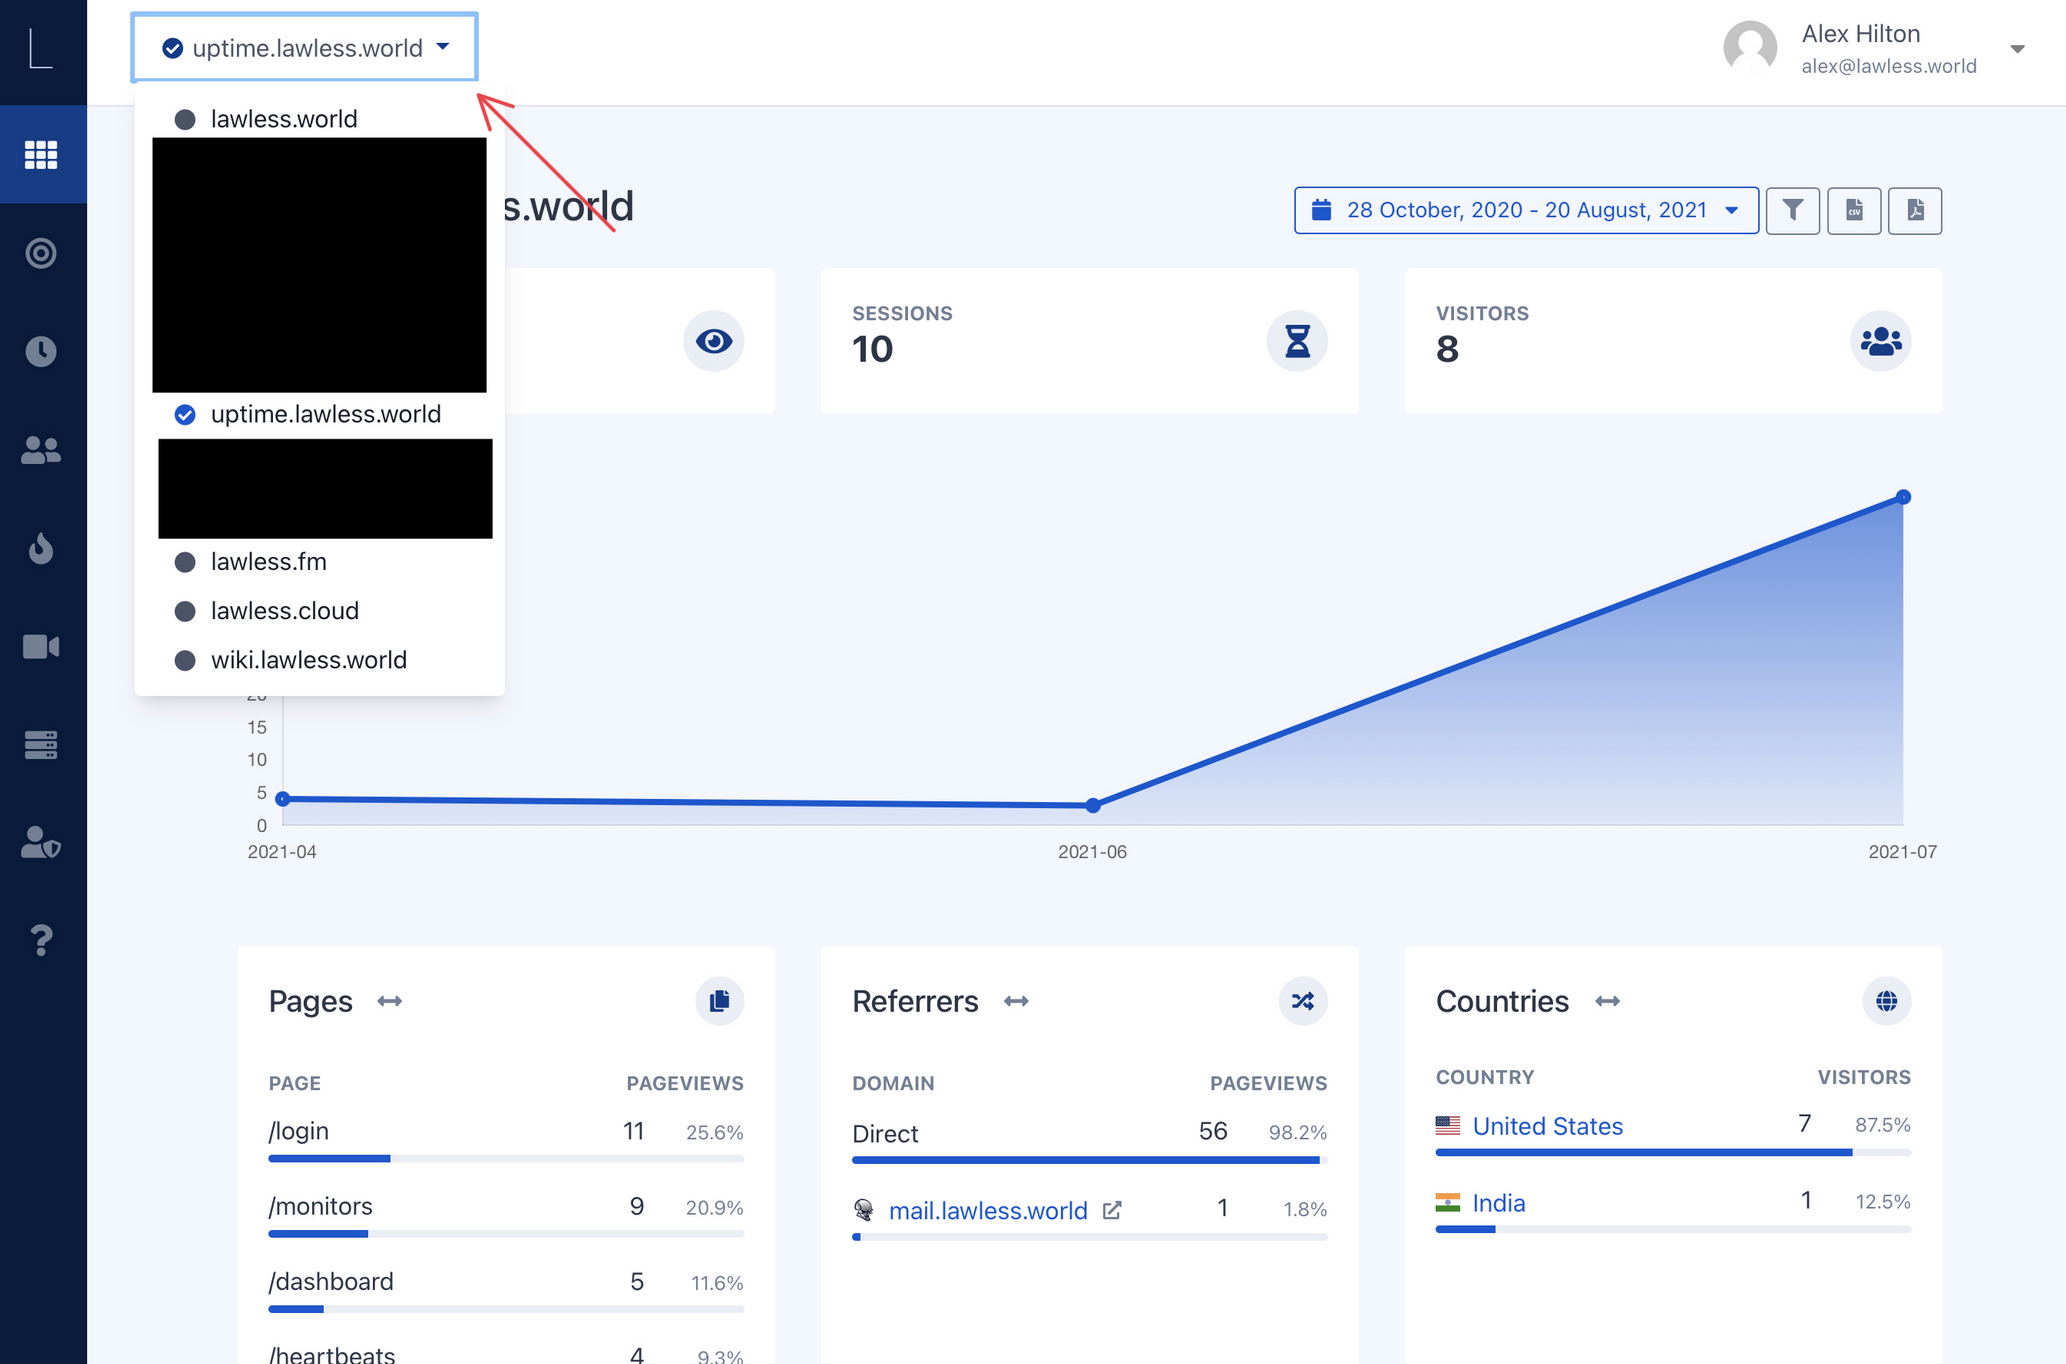
Managing different websites
For those whom manage multiple websites like myself, you will see in the image above and a detailed in the top left hand corner the website a detailed view below. This gives you the ability to flip through the websites you manage quickly and easily.
Widgets
Within the Dashboard Section I will cover each of the Widgets on the Dashboard Page as each widget dives deeper than initially realized. Being that this is where the meat of the data resides the widgets listed below have their own sections. I wasn't joking when I said the dashboard is simple but powerful!
Pages
The pages widget will show you the overview of 3 visitor page types that is set from the date filters on the dashboard page (Alternatively you can edit what date range you want to select from any page.) Each widget will give you the % for Page views and the bounce rate (bounce rate is the percentage that users leave your site from on that specific page.)
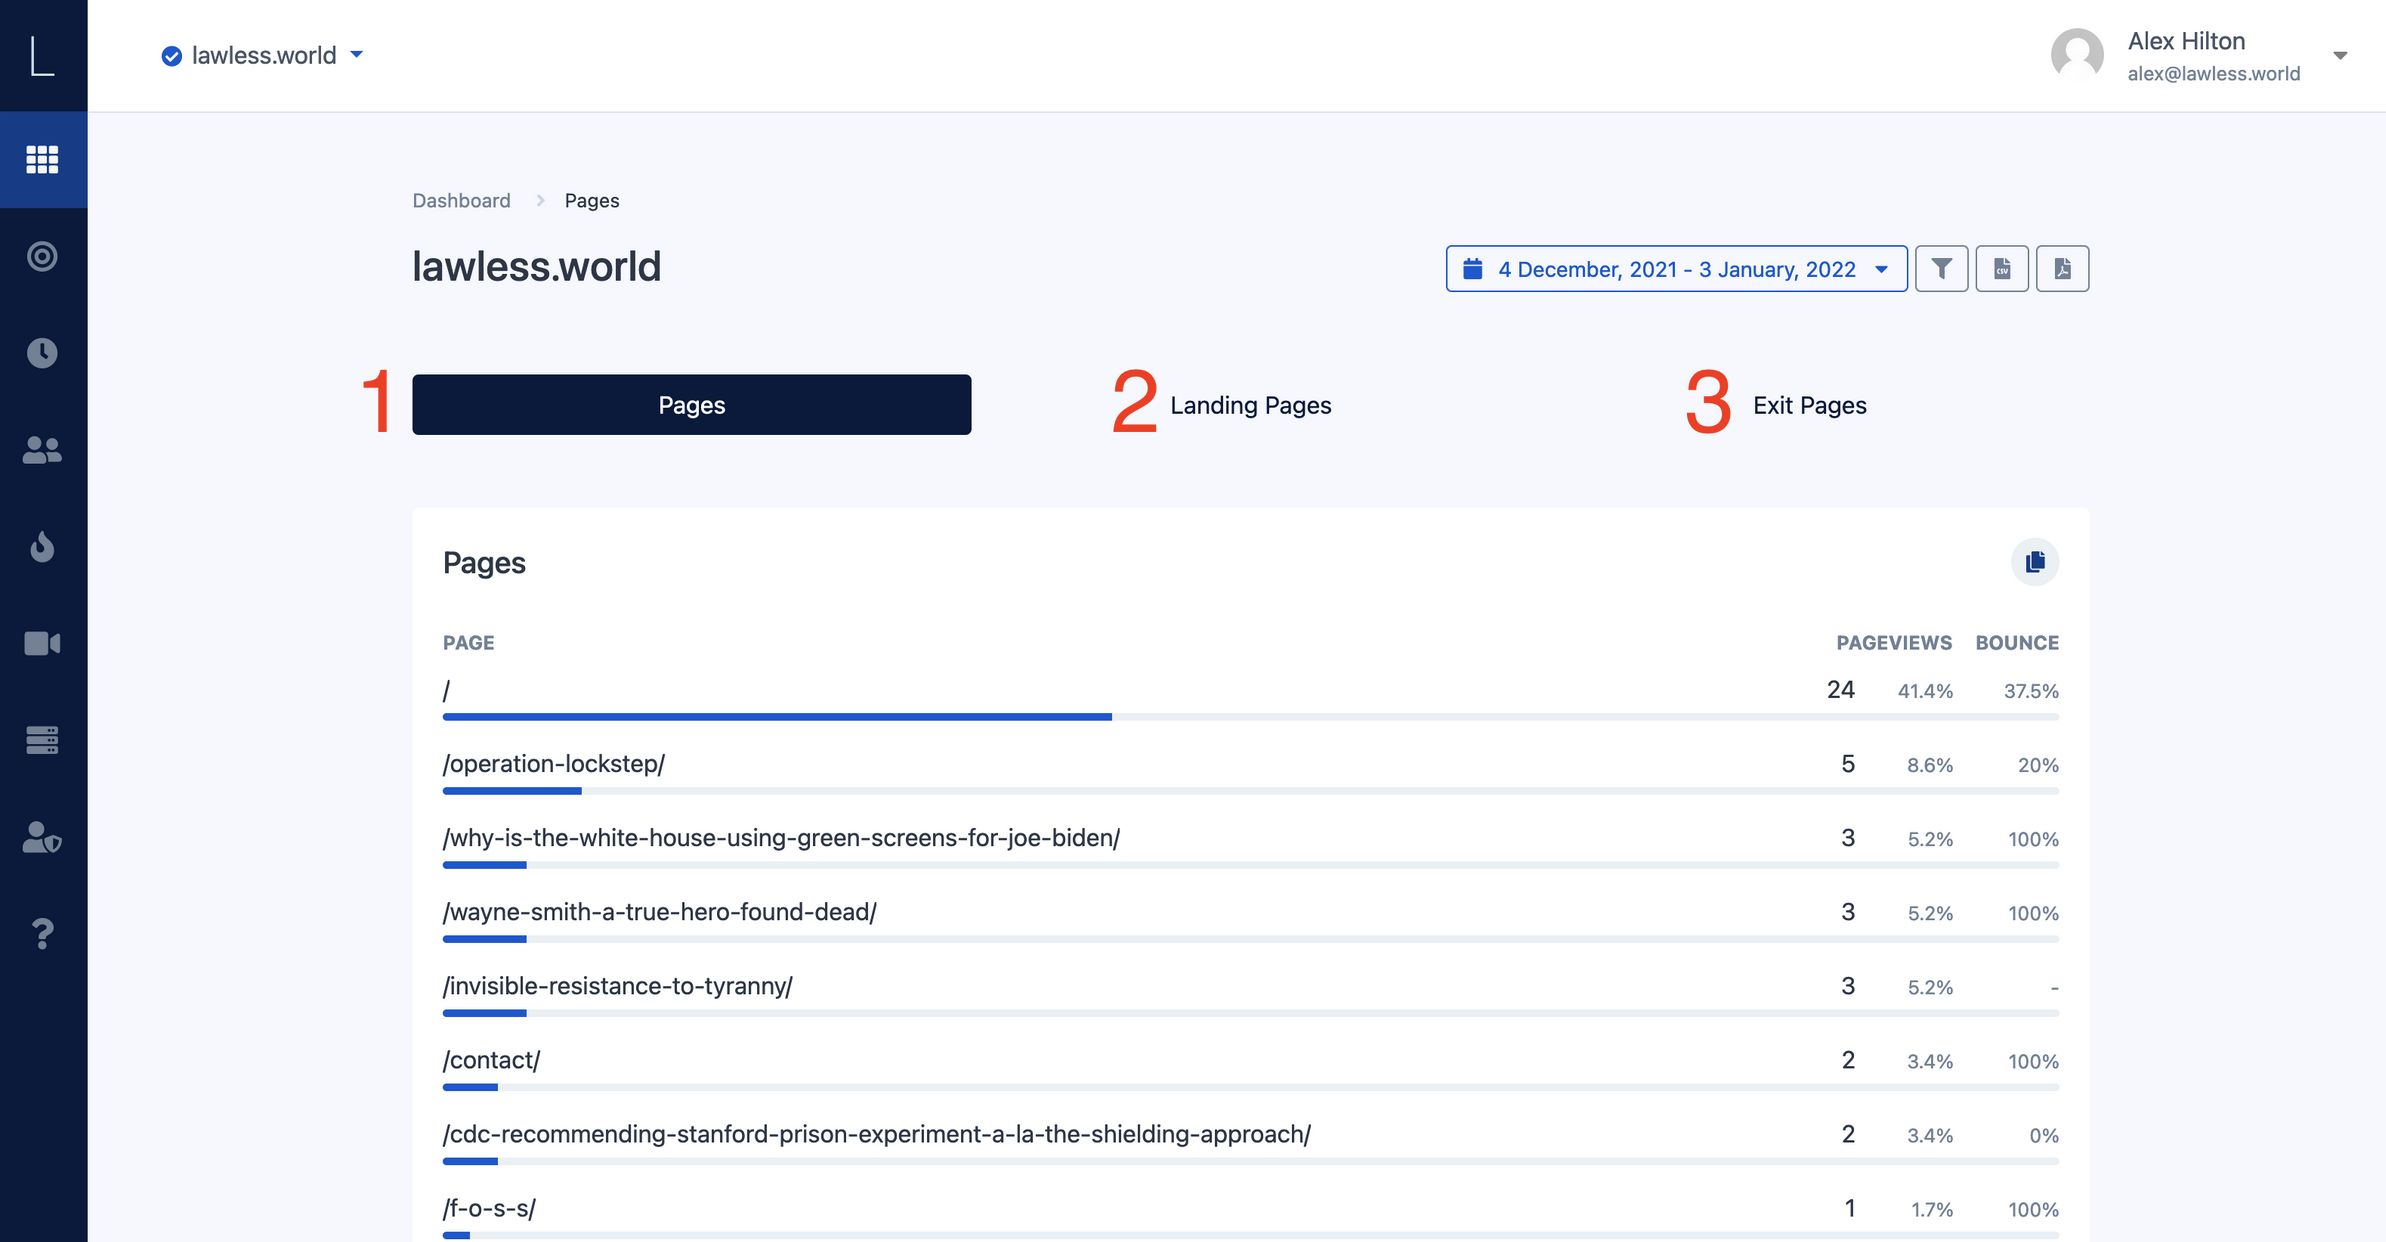
- Pages - this gives you an overview of the pages on your site that are most viewed to least viewed and is the default tab selected once selecting the view more option on the dashboard.
- Landing pages - this gives you the overview of what pages your visitors are landing on when first coming to your site
- Exit Pages - Exit pages are just that, the page that your visitors exit your site on
Referrers
Understanding where and how your visitors are getting to your website is important for any business to understand. The dashboard widget ‘Referrers’ gives you a high level overview of three different aspects and they can be accessed by clicking any of the tabs at the top of the page. Just like the ‘Pages’ widget gives you page views and bounce rate %'s, so does this widget (and all other widgets.)
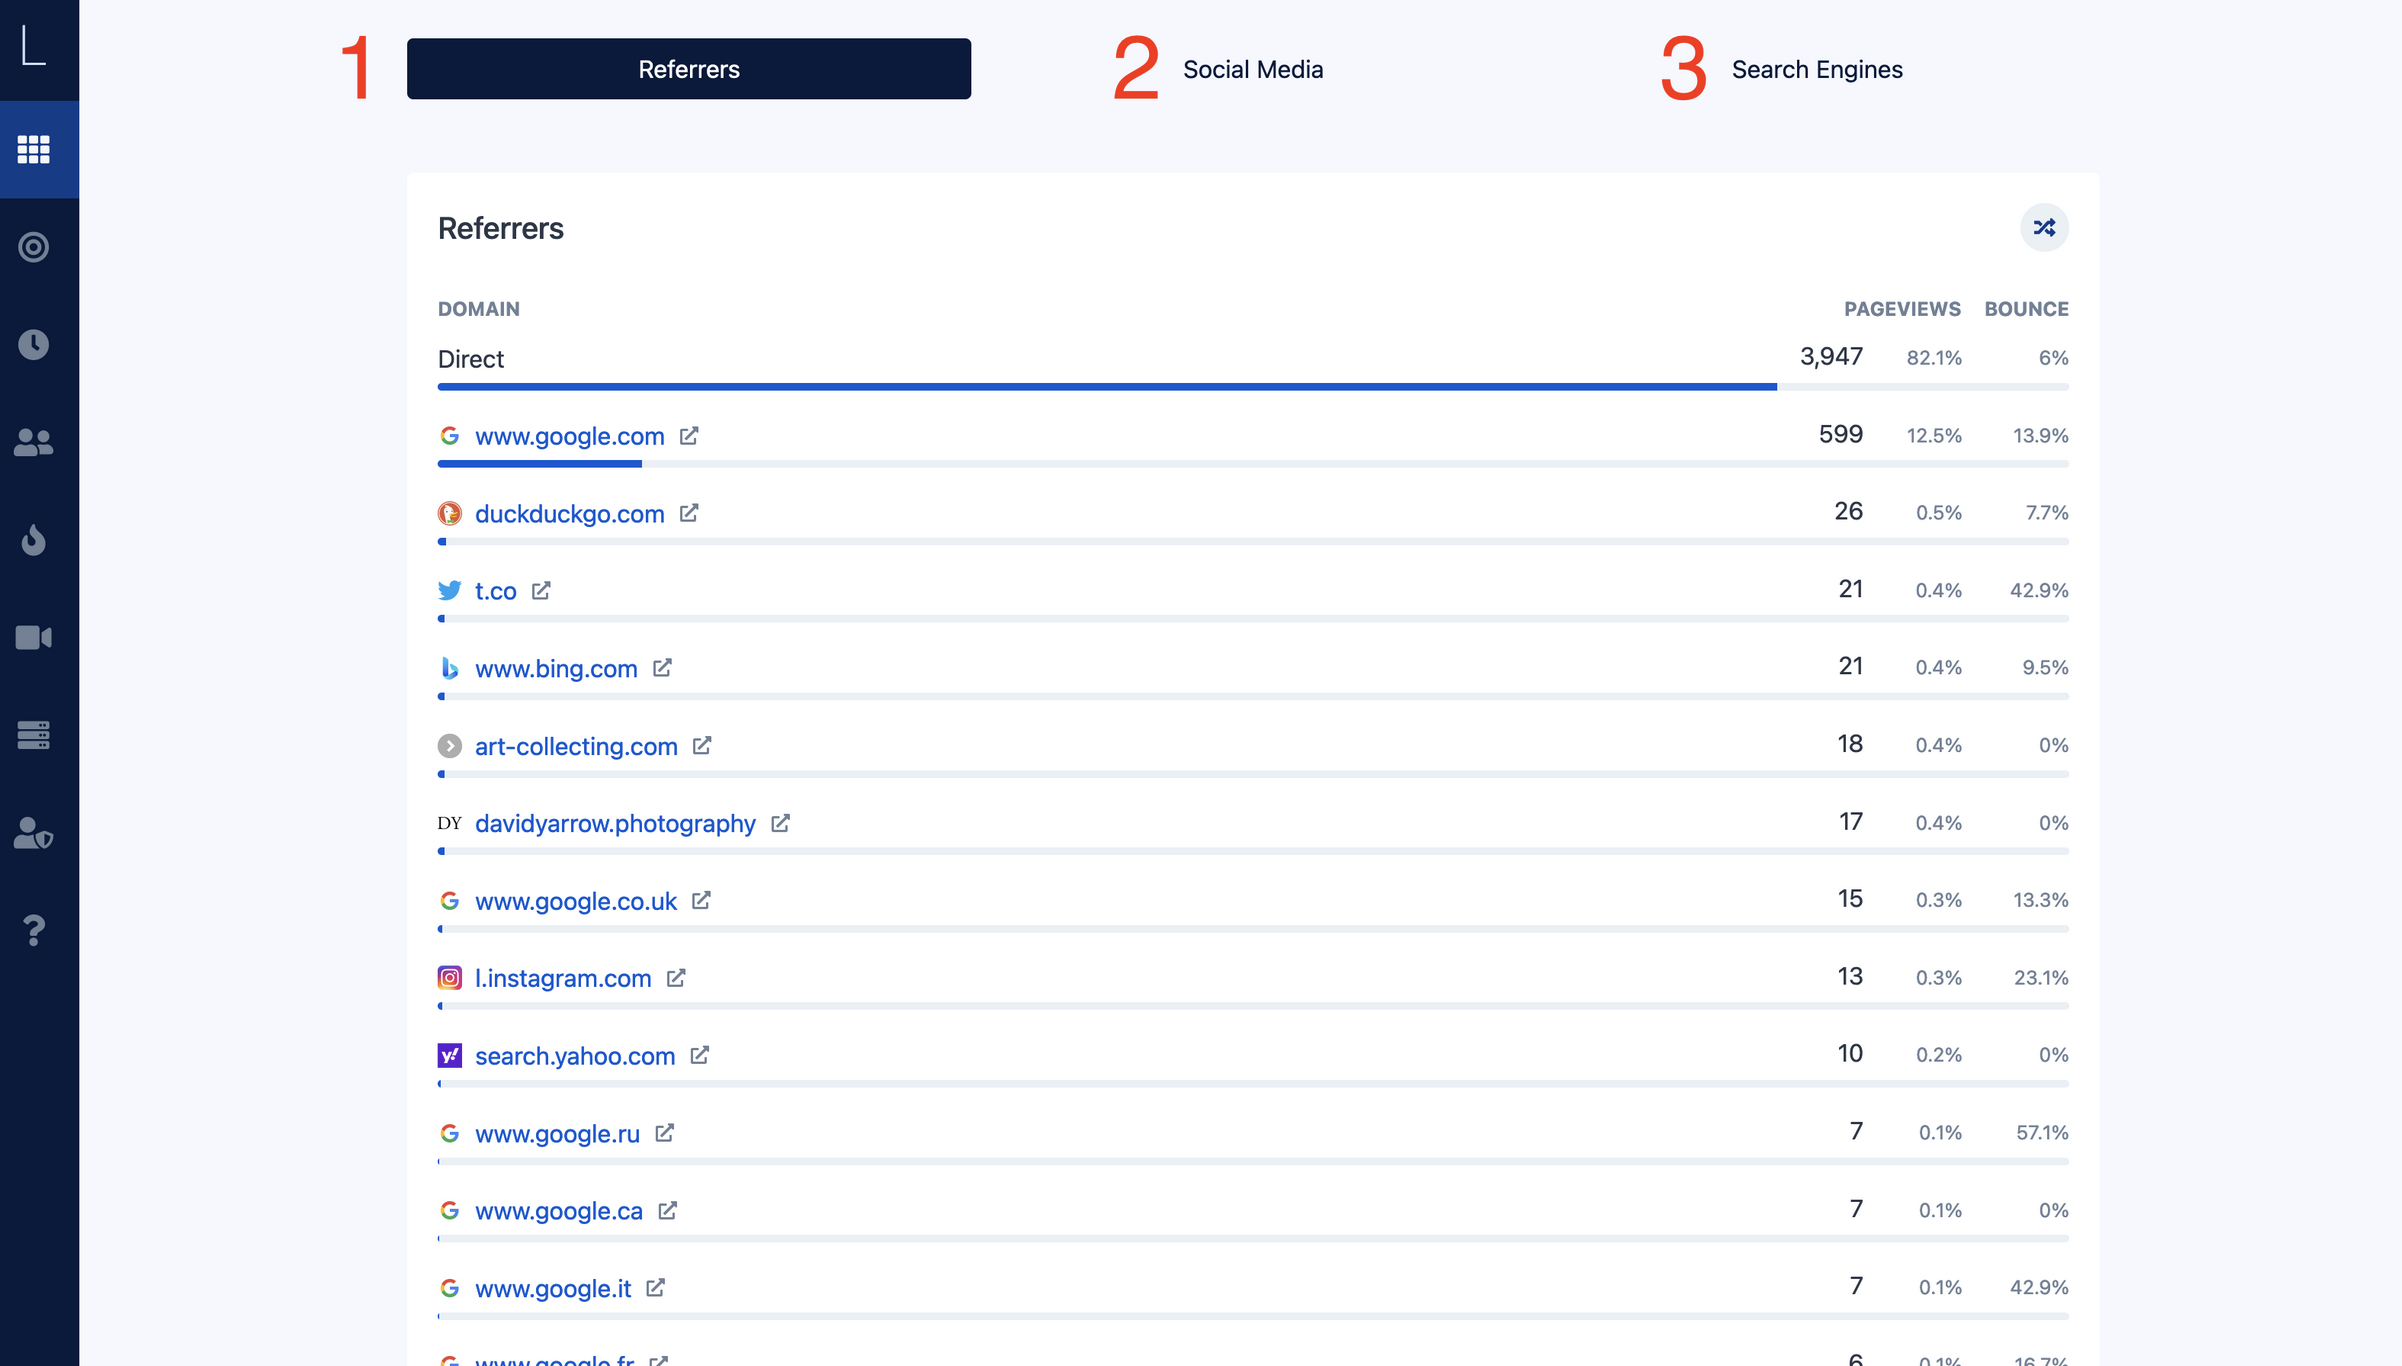
- Referrers - this allows you to view the general website from which your visitor came to your site. Clicking the name of the site will hyperlink you to their site as well.
- Social Media - Social Media sites which have referred visitors to your website.
- Search Engines - Search engines which have referred visitors to your website.
Countries
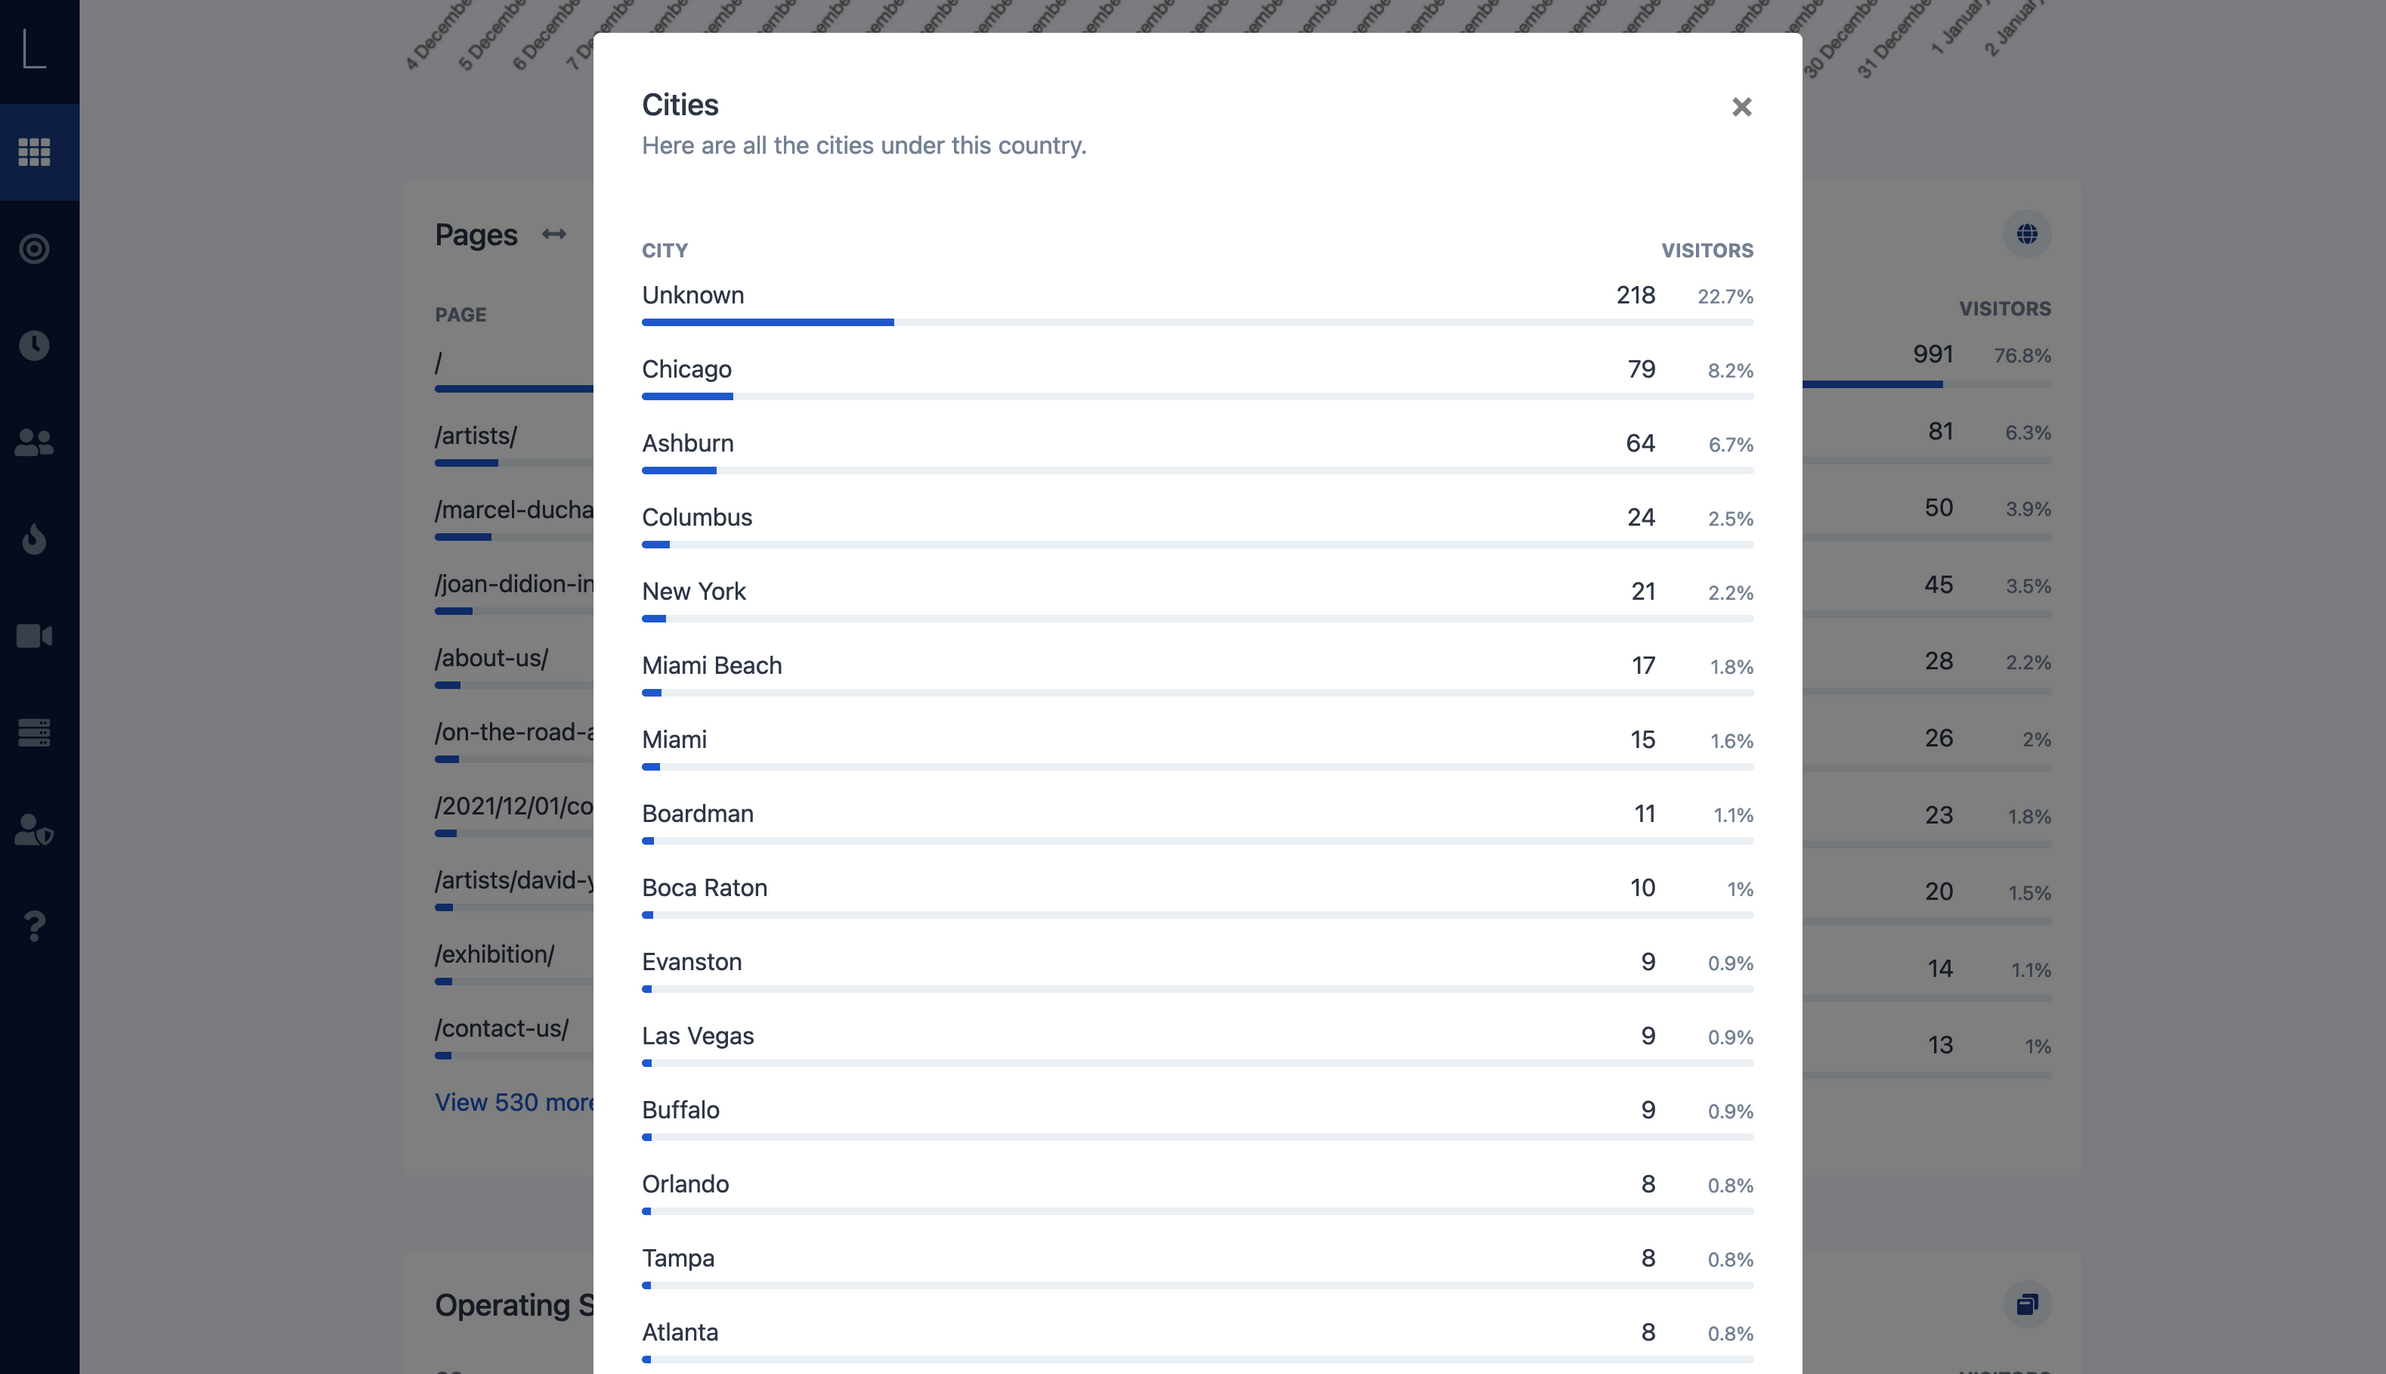
The country widget on the dashboard page gives you an overview of both the country and the city that your visitor arrived to you from. Different from other widgets on the dashboard page, when you click the corresponding countries name you want to view, it will give you a popup of the cities from where your visitors derived from.
Unlike other widgets, there are no corresponding tabs on the countries page itself however you are shown an interactive map. When hovering or clicking the country you want to get quick stats on (on a mobile phone) will show you a quick view of how many visitors you have from each country.
Clicking the name of the country will give you an breakdown of visitors by city.
Country Page
 Country page also gives you analytics for the city your users come from
City overview
Cities can be viewed by clicking the country name on the dashboard page or by clicking the name on the dashboard widget itself.
 If your visitor has “DNT” (Do Not Track) enabled then there will be no analytics for them on your site
UTM's
“UTM” stands for “Urchin tracking module.” Which to give you some more background, Urchin Software Corporation was acquired by Google in 2005, and this is basically what we now know as Google Analytics.
In a nutshell, UTM codes are bits of text you can add to a link that tell your Lawless Analytics account more information about each link.
This is what an example of a UTM link looks like;
https://analytics.lawless.world/landing-page?utm_source=chaos&utm_medium=email&utm_campaign=march2012
The link above may not look like much, but it answers 3 Essential Questions.
- Where is the traffic coming from?
- How is it getting to me?
- Why is it coming to me?
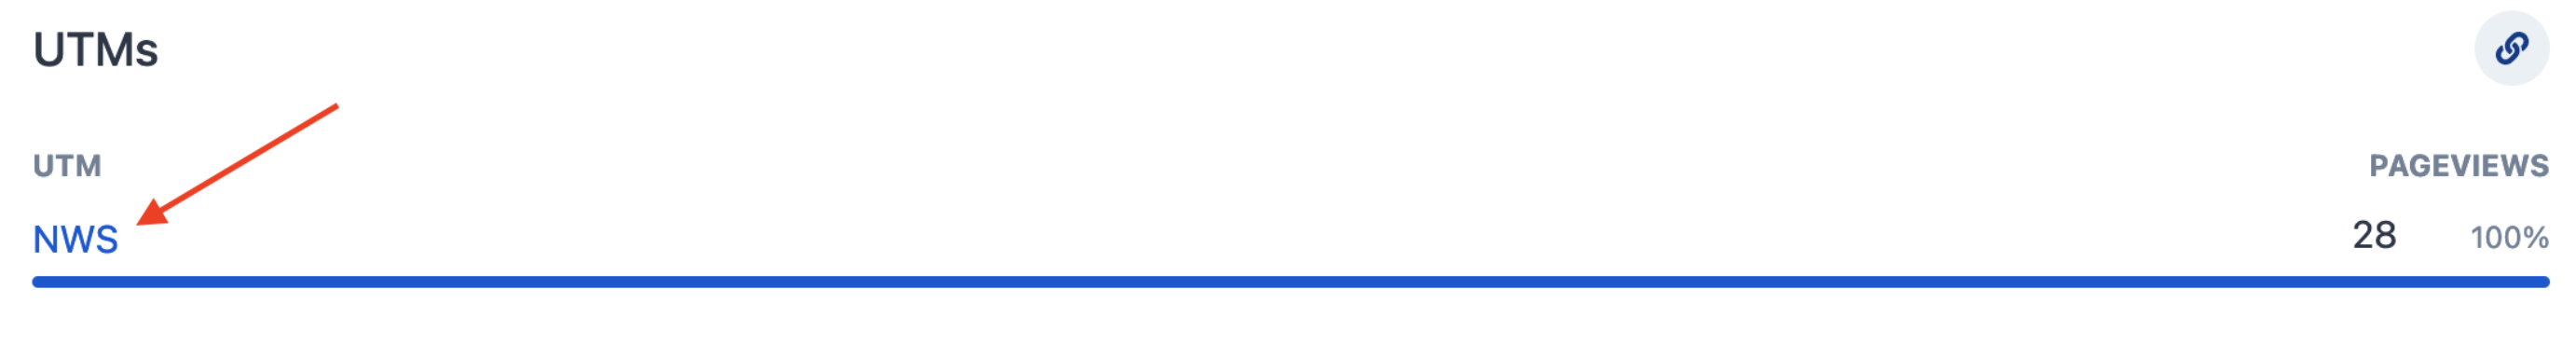
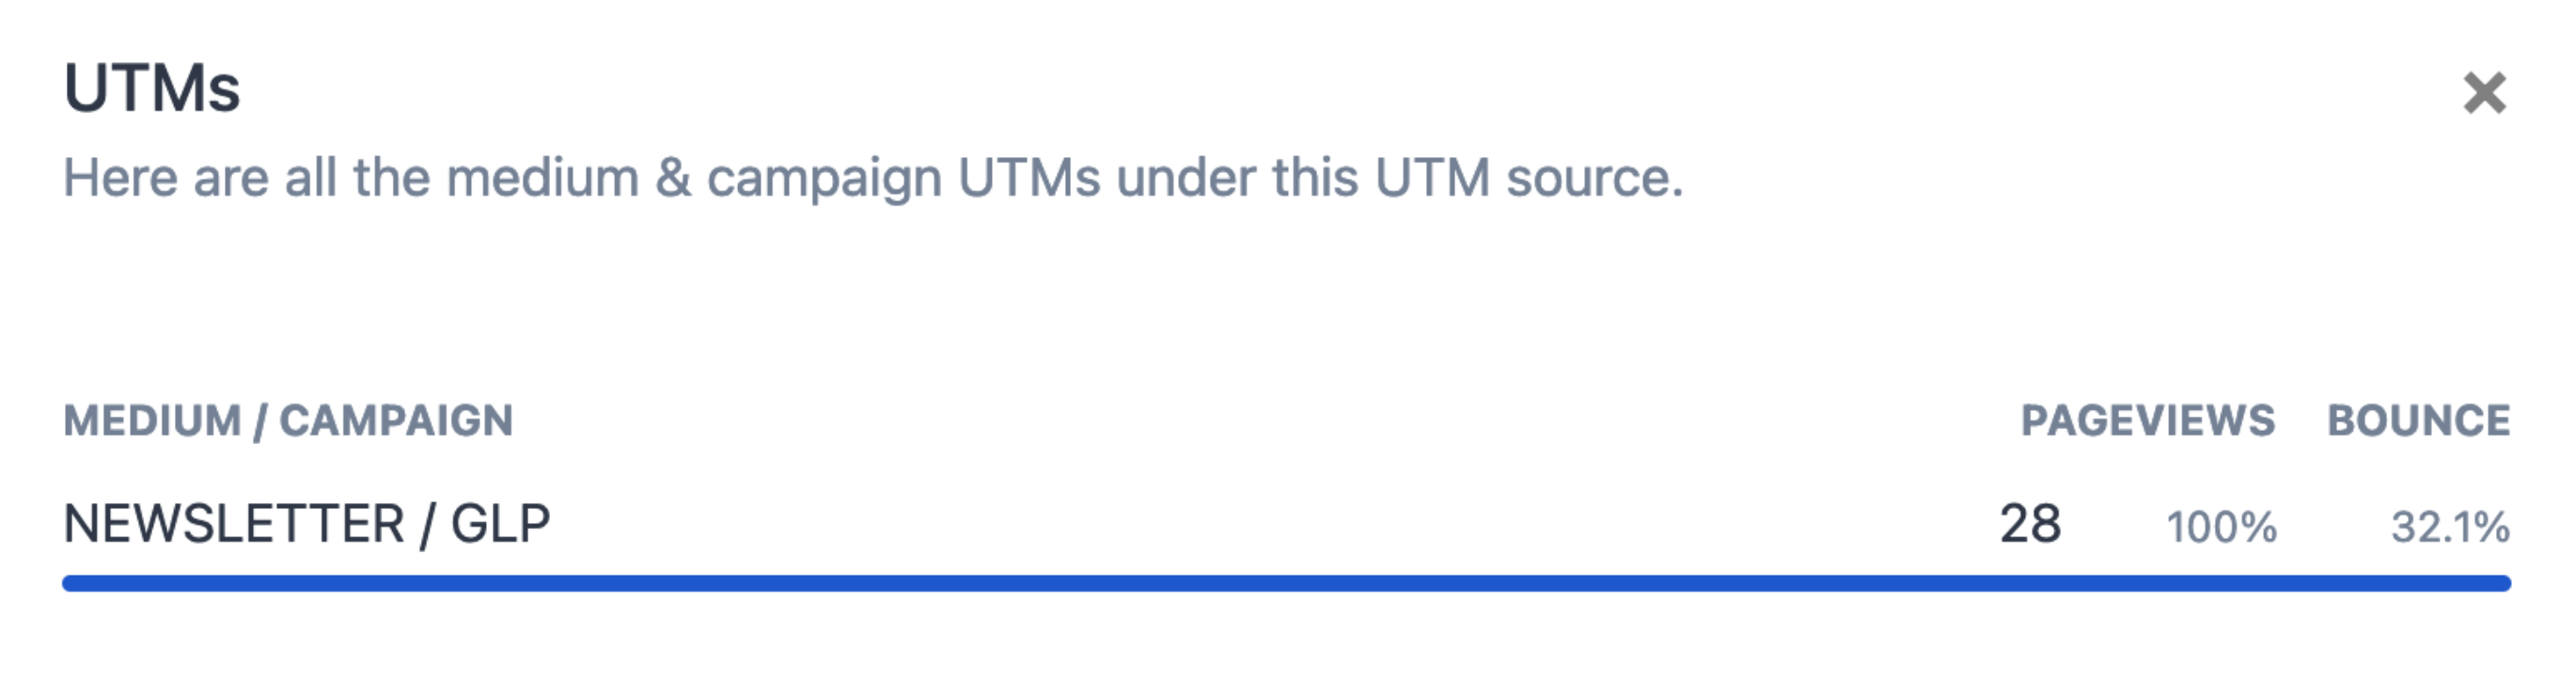
In the widget when going to the page, you will see a list of all UTM's that have logged on the system.

Clicking the hyperlink will you the information you need regarding your UTM.
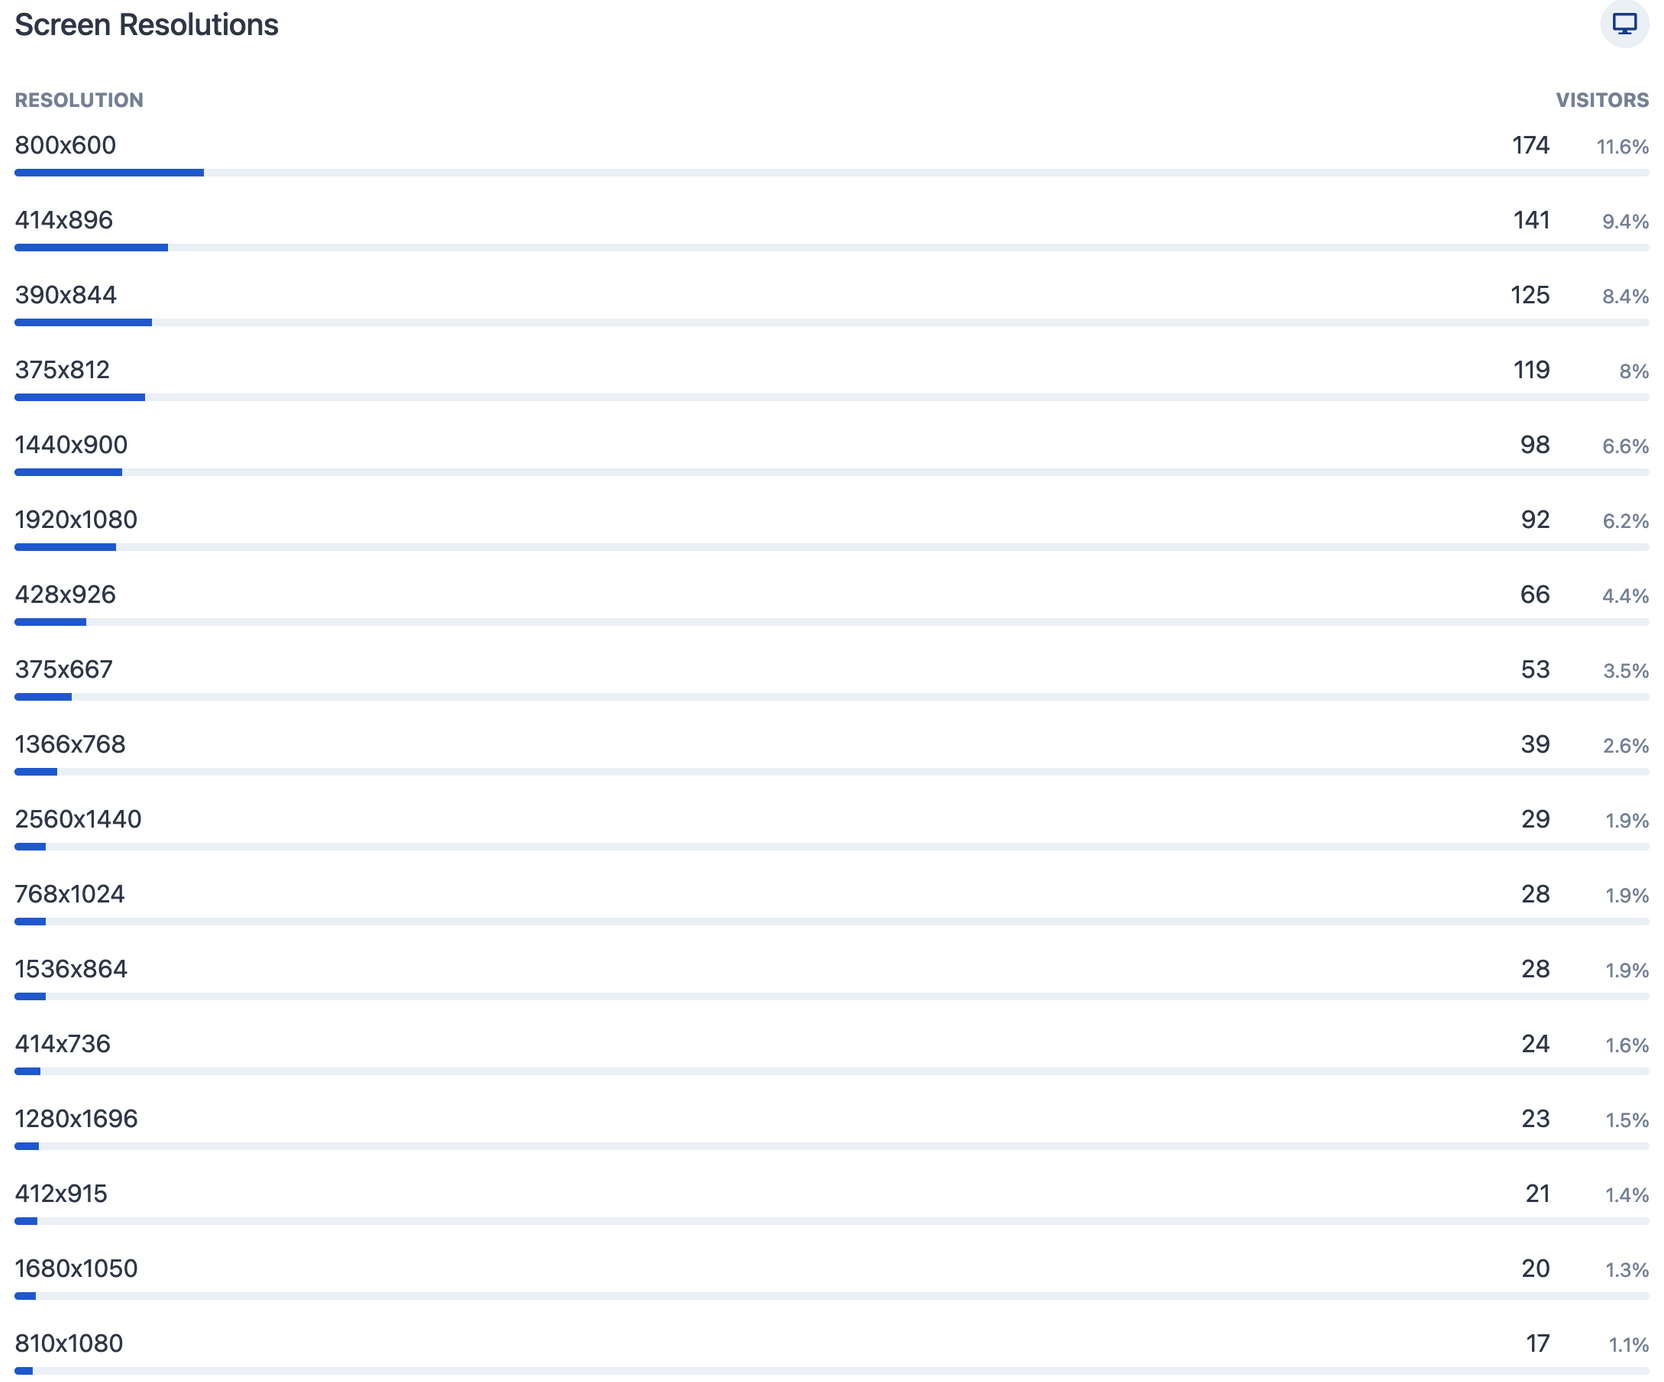
Screen Resolutions
Screen resolutions will give you a quick overview of the sizes of screens your users view your website from and for web development, it's a crucial piece of information to understand so you can build accordingly. In the image below, you can see how many different types of screen sizes there are and in web development, there is truly no “one size fits all" when dealing with visitors to your site or app.
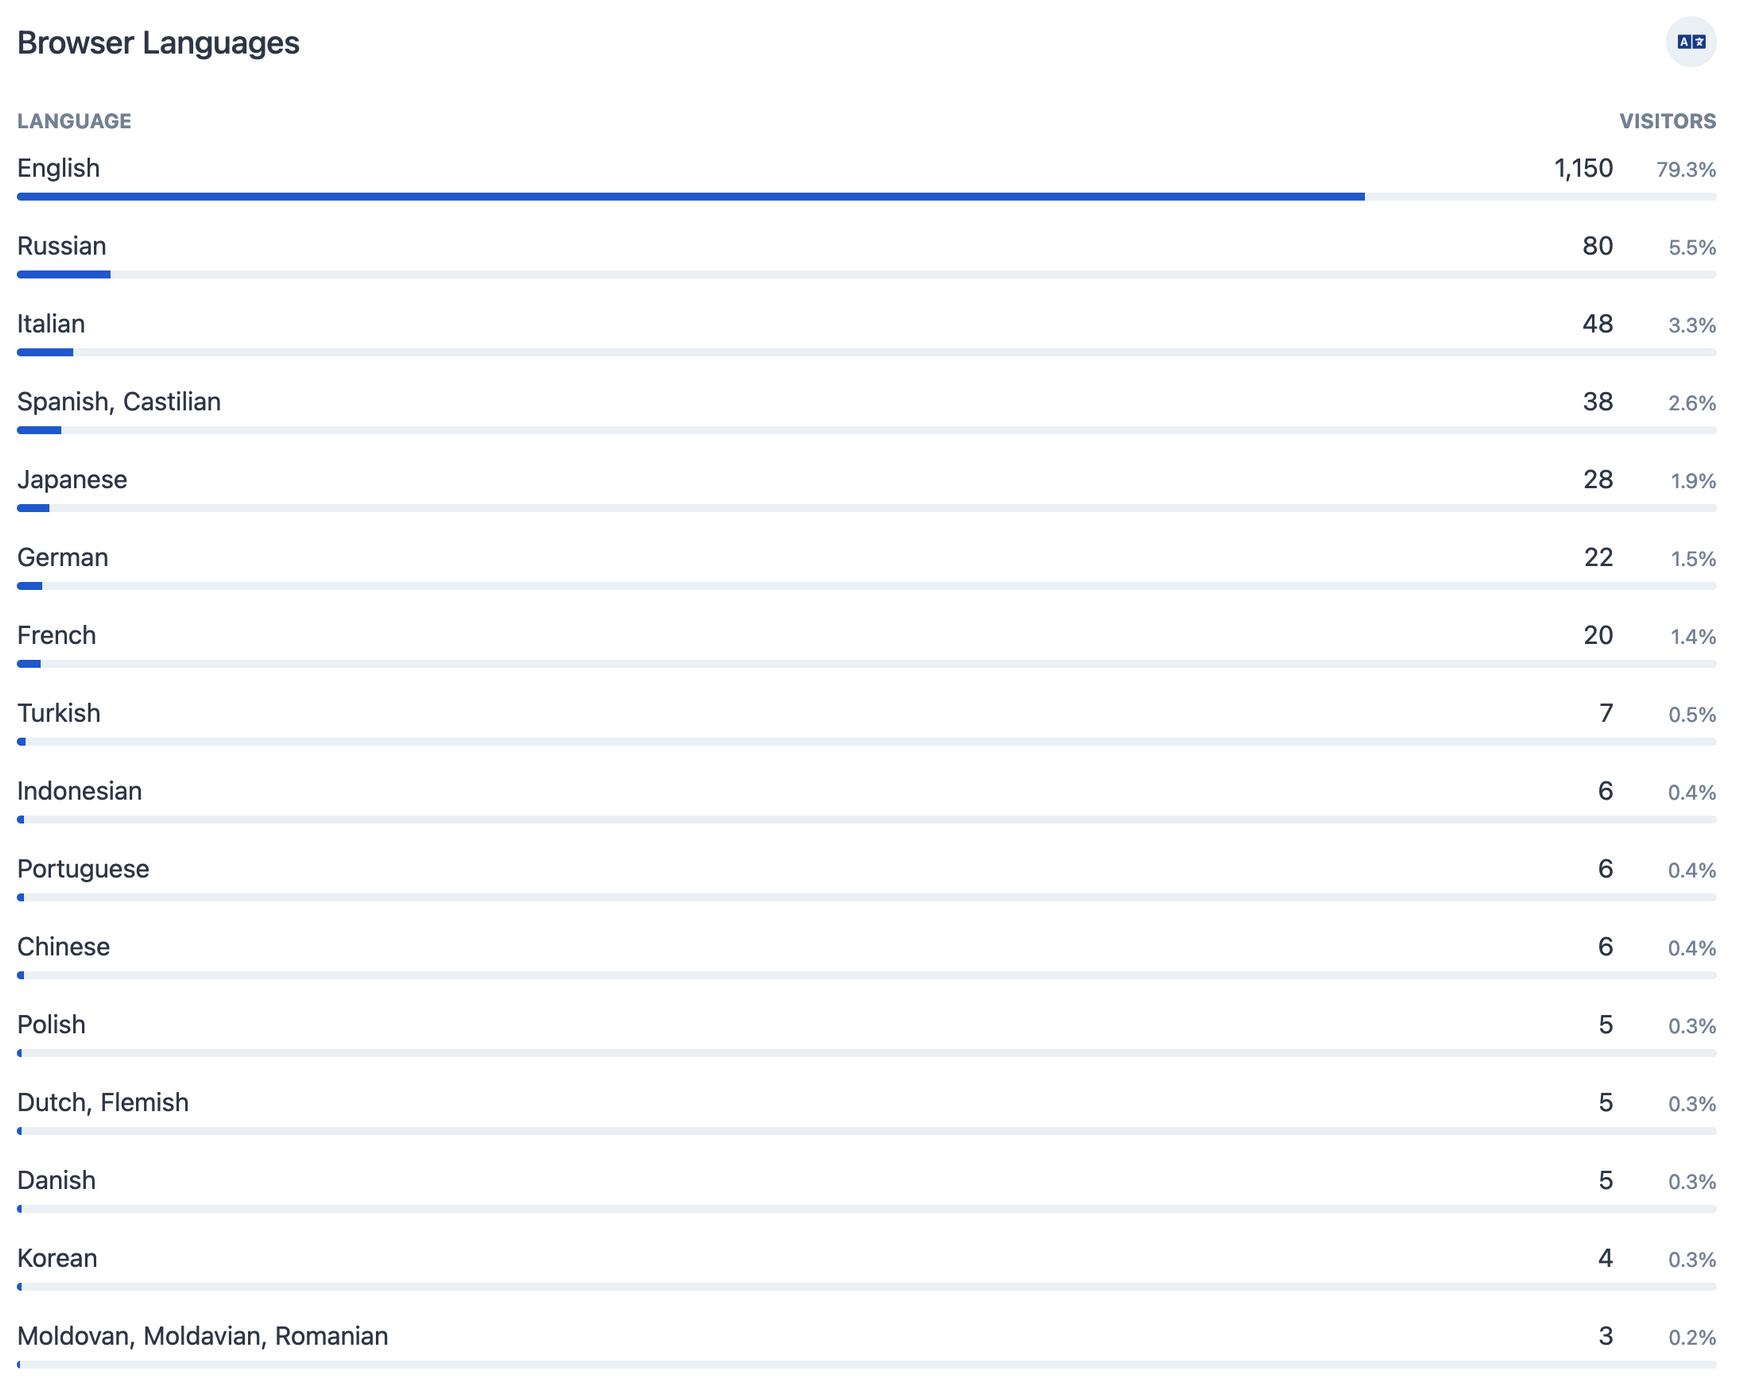
Browser Language
Browser language is just that, the language that your visitors are coming to your site using. So for example, if you are a US based firm, but everyone coming to your site is speaking Russian, it may make sense to hire a Russian speaking individual.
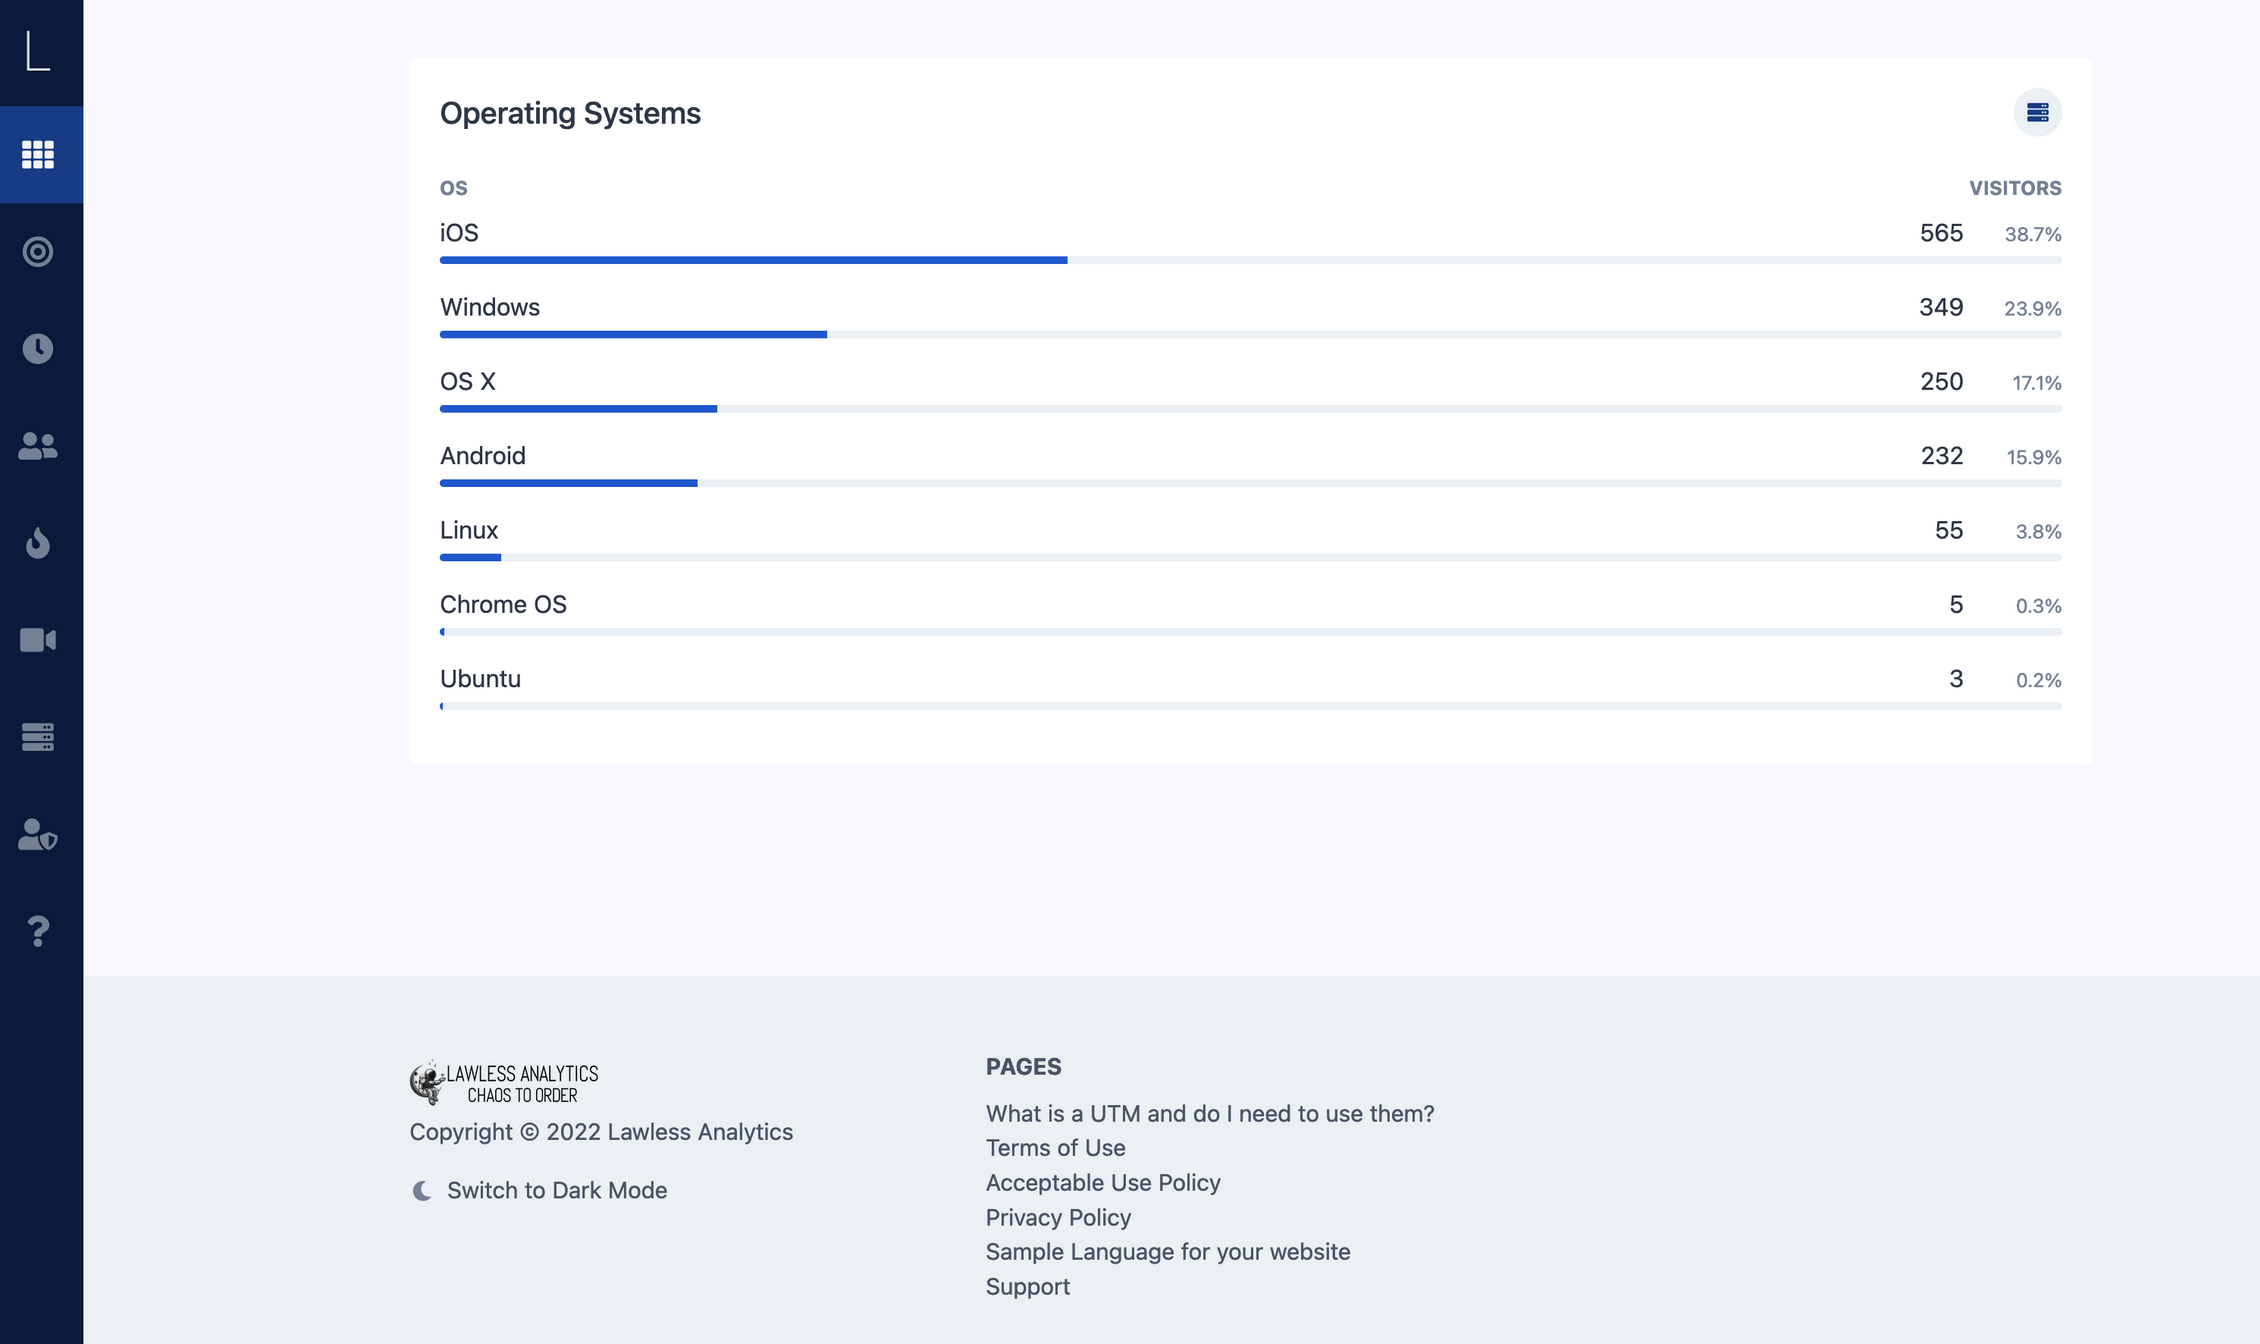
Operating Systems
To see a view of the operating systems your users access your site, this is a handy widget.
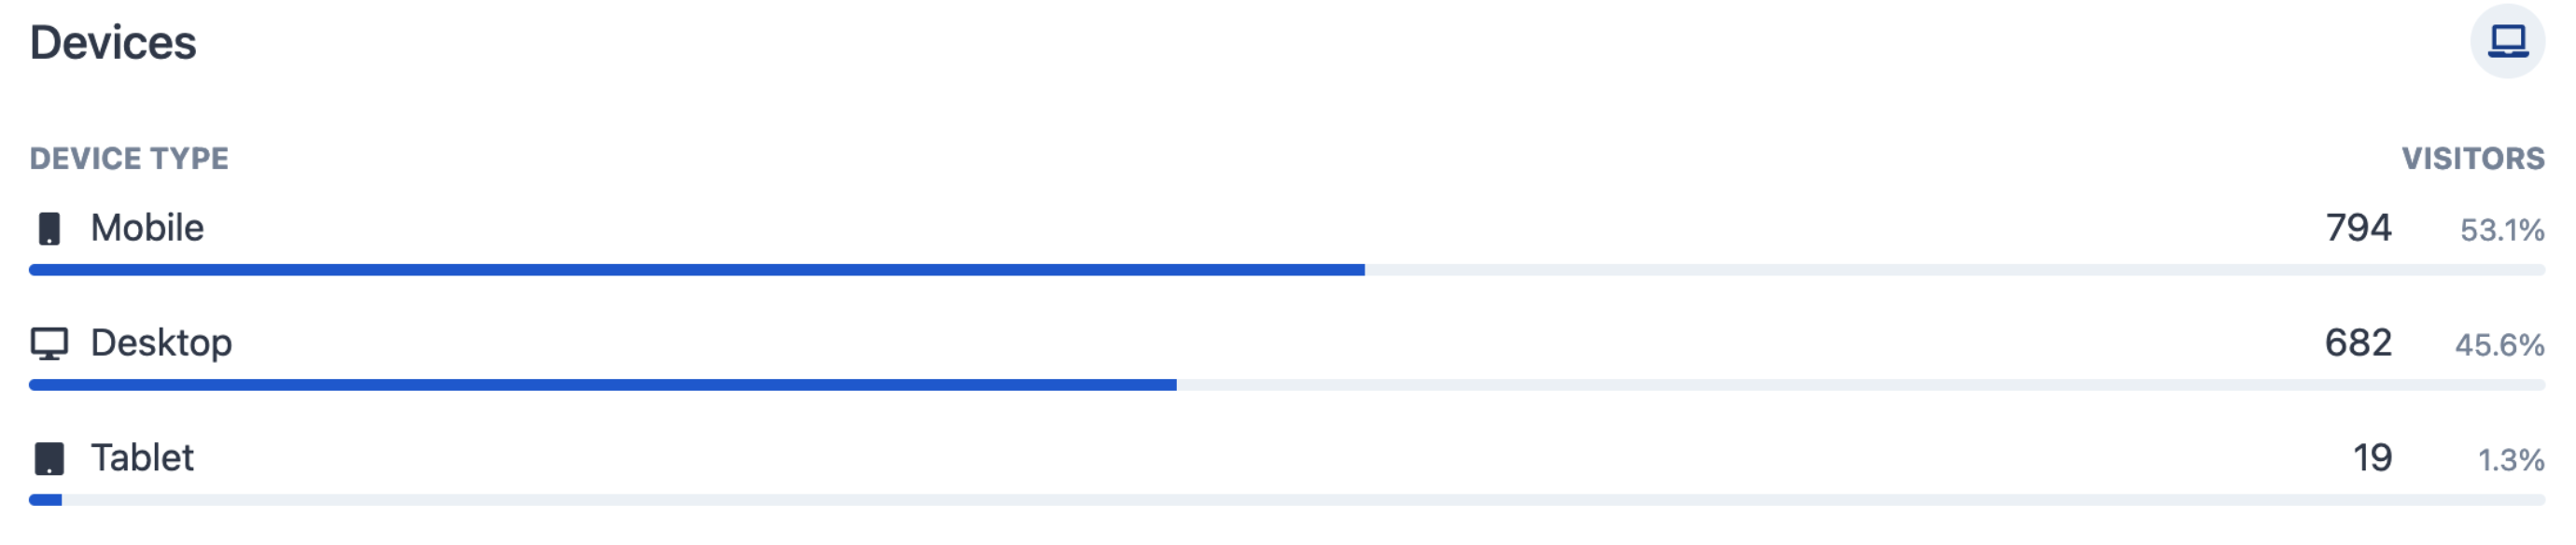
Devices
The devices widget gives you a quick overview of the three device types that can visit your site or app.
- Mobile
- Desktop
- Tablet
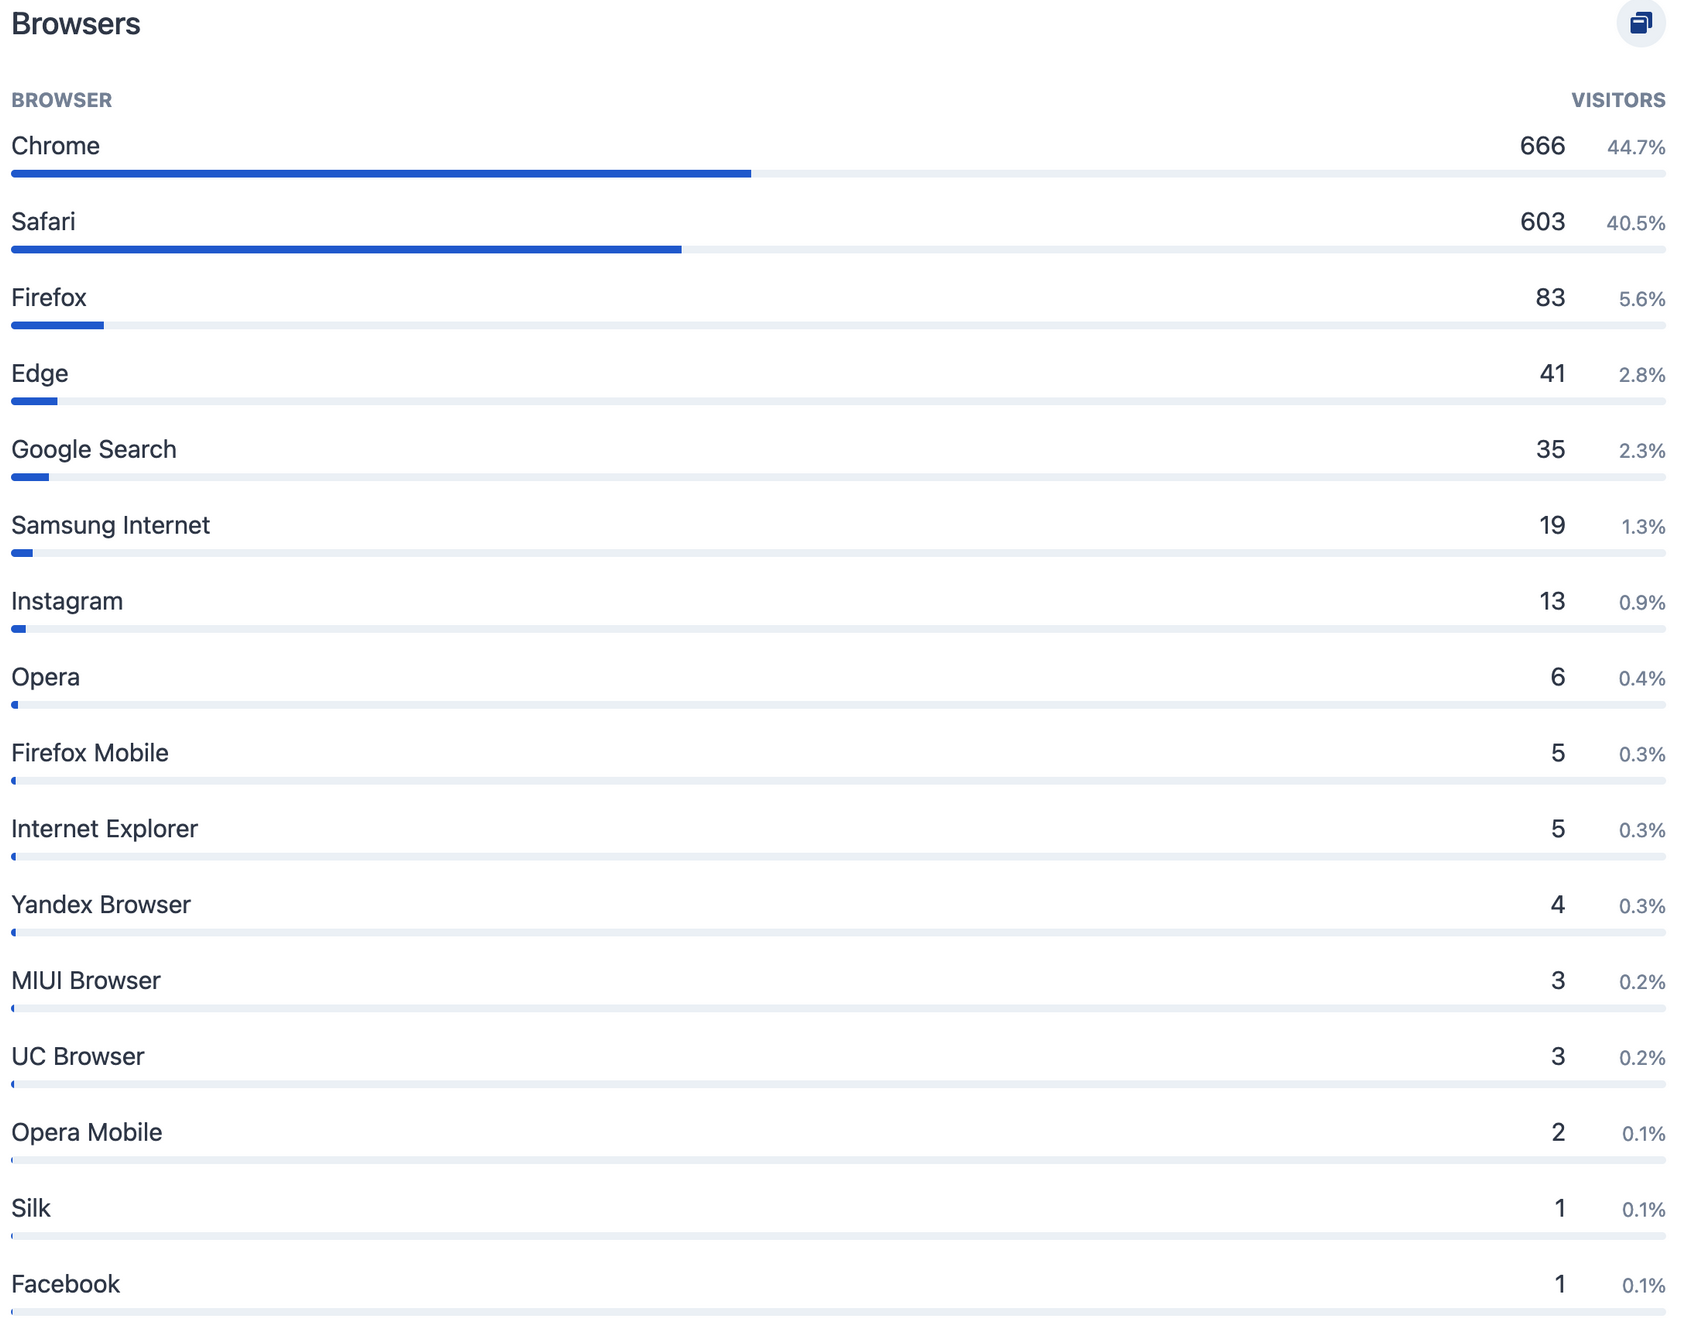
Browsers
The browsers widget tells you which web browser was used during their visit to your site.